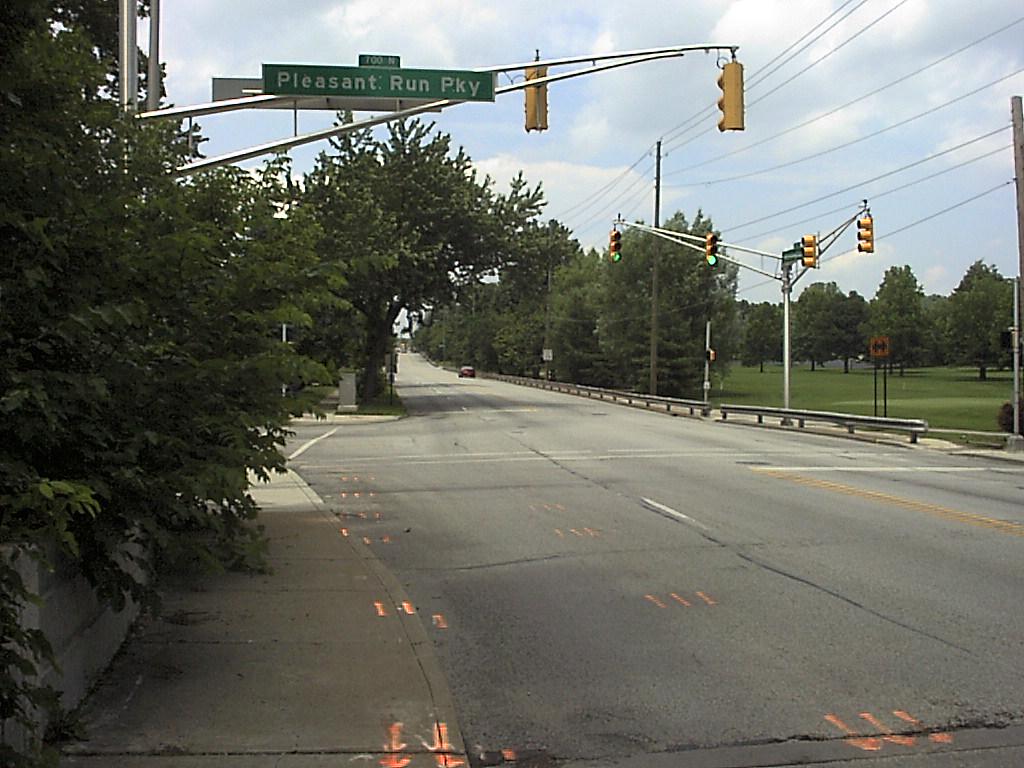
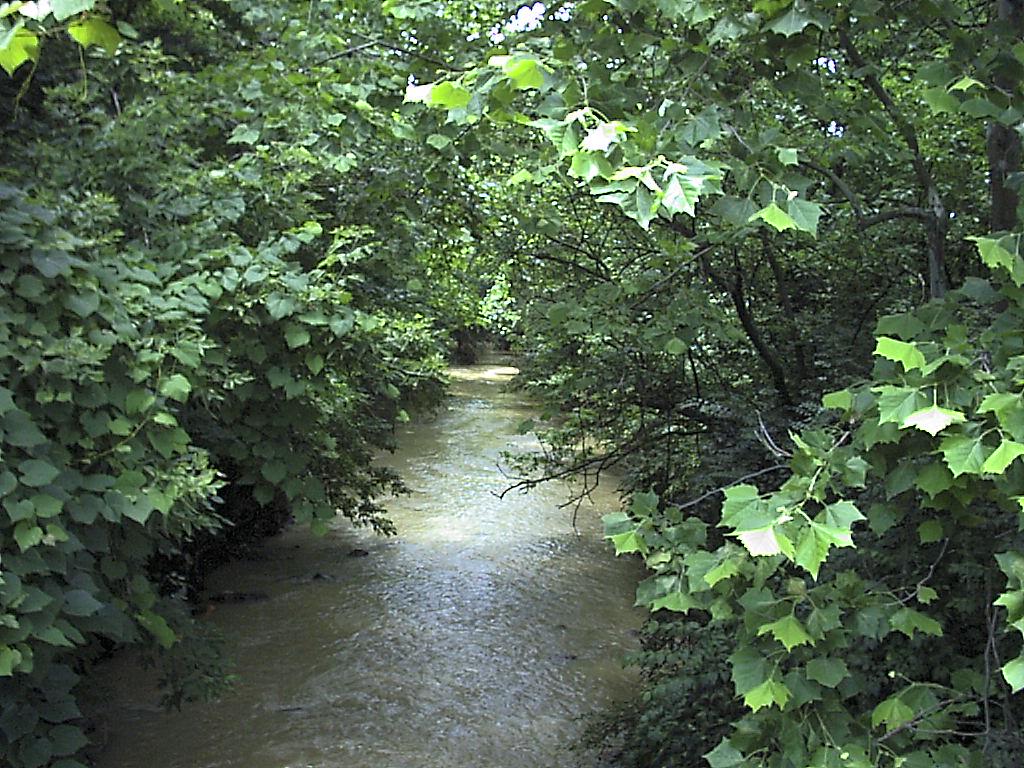
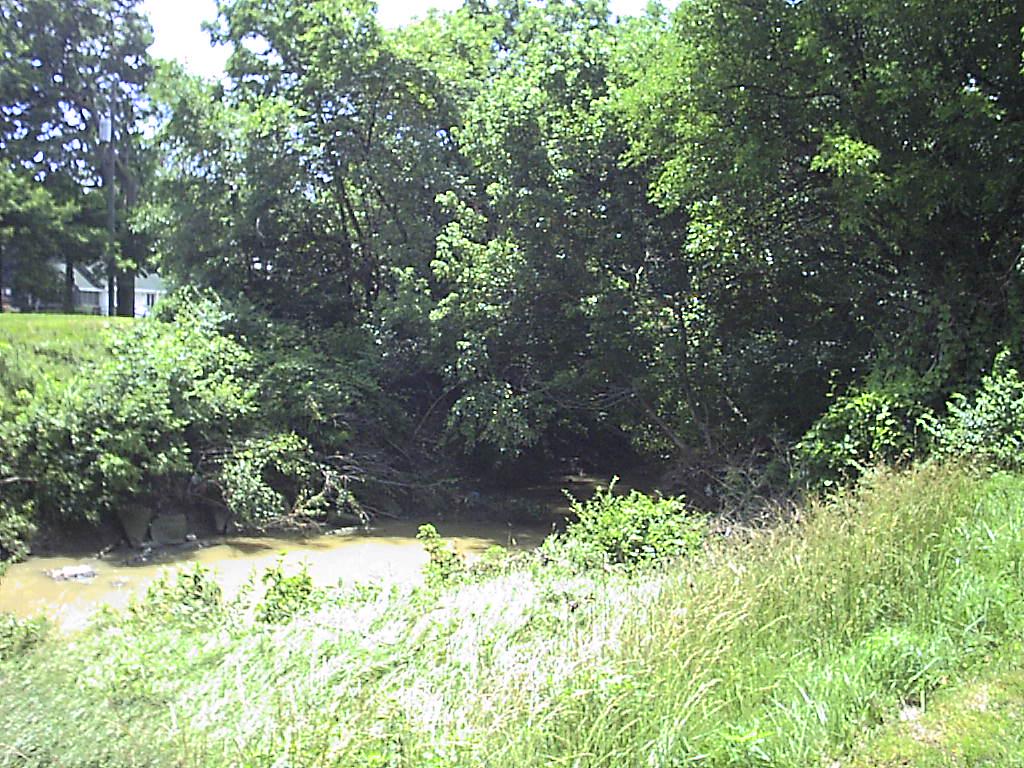
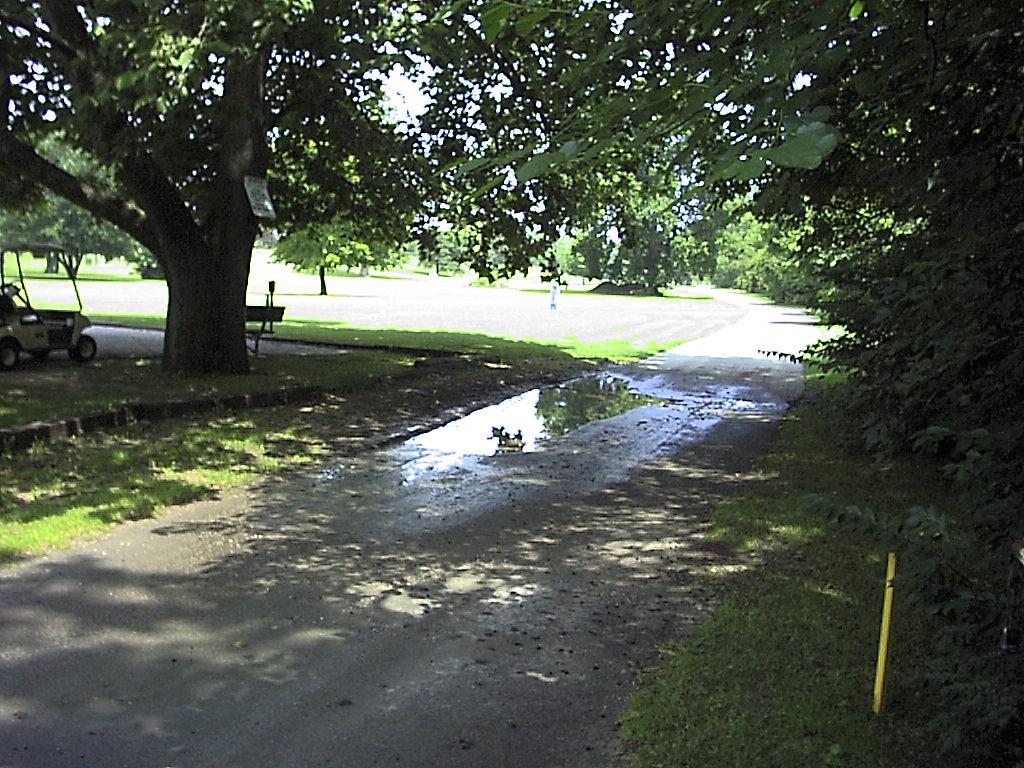
Pleasant Run at Arlington Avenue in Indianapolis
Future / Actual / Minor
OWP 2.0 WWA Modal Title
01/11/2021, 10:04 PM UTC through 01/11/2021, 10:04 PM UTC
Sender
Sent
- Upstream gauge unavailableWarning: no valid ratings curve available. Transformations to and from FEET/CFS/KCFS will not happen.
Traces and Thresholds Click to turn on/off display
Observed (OBS) 04/01/2025 5:15 AM EDTRecord: 16 ftLow Threshold: 0.1 cfsCATEGORY STAGE 
Major Flooding 13 ft Moderate Flooding 10 ft Minor Flooding 8 ft Action 6 ft Reliability of the Forecast:
NOTE: Forecasts are not available. Only observed stages are available for this point.
National Water Model Hydrograph
Official NWS streamflow forecasts are produced by NWS hydrologic forecasters for river gauge locations using hydrologic models which are calibrated to that location. This process considers additional guidance and information, including local expertise and experience, to produce the best forecast possible. The NWM output provides supplemental guidance to NWS forecasters and should not be considered an official NWS river forecast.
Flood Impacts
- 16 - Flash flood level of May 28, 1956. Very serious flooding on the east side of Indianapolis. In May 1956, this area was part of 40 to 50 square blocks flooded by Eagle Creek, Pogue's Run, Pleasant Run and other small streams. Most of the 2,000 families evacuated were located on the eastern and southeastern part of the city. Water was 5 to 6 feet deep in many streets. Rainfall of more than 4 inches fell in less than 4 hours on very wet grounds.
- 14 - Arlington Avenue impassable. Extensive flooding of Pleasant Run Golf Course. Much of the low ground in Ellenberger Park is flooded. Serious flooding in the Sherman Drive area near downtown Indianapolis and near Shadeland Avenue on the eastside. Approaching possibly a flood emergency. Highest flood level since May 1956 and nearing a record flood.
- 13.7 - Approximate low steel of Arlington Avenue Bridge over Pleasant Run. Arlington Avenue begins to flood on the north side of Pleasant Run. Highest flood level of Pleasant Run since June 1978. Approaching serious flooding in the vicinity of Sherman Drive near downtown Indianapolis and Shadeland Avenue on the eastside of Indianapolis.
Gauge Info
| Coordinates | 39.7758, -86.0639 |
| RFC | OHRFC |
| State | IN |
| WFO | IND |
| County | Marion |
| Data Provider(s) | |
| US Geological Survey | USGS--Water Resources of the United States |
| USGS | 03353120 |
Gauge Location
Recent Crests
| 1. | 7.60 ft | on 09-08-2018 | |
| 2. | 8.72 ft | on 04-03-2018 | (P) |
| 3. | 6.01 ft | on 02-24-2018 | (P) |
| 4. | 8.46 ft | on 07-11-2017 | (P) |
| 5. | 6.86 ft | on 06-30-2017 | (P) |
Recent Crests
| 1. | 7.60 ft | on 09-08-2018 | |
| 2. | 8.72 ft | on 04-03-2018 | (P) |
| 3. | 6.01 ft | on 02-24-2018 | (P) |
| 4. | 8.46 ft | on 07-11-2017 | (P) |
| 5. | 6.86 ft | on 06-30-2017 | (P) |
| 6. | 7.28 ft | on 06-23-2017 | (P) |
| 7. | 6.87 ft | on 04-30-2017 | (P) |
| 8. | 10.20 ft | on 08-26-2016 | (P) |
| 9. | 8.55 ft | on 08-24-2016 | (P) |
| 10. | 8.02 ft | on 06-15-2016 | (P) |
| 11. | 7.39 ft | on 12-27-2015 | (P) |
| 12. | 11.33 ft | on 07-26-2015 | |
| 13. | 11.26 ft | on 07-07-2015 | |
| 14. | 9.78 ft | on 06-26-2015 | |
| 15. | 8.64 ft | on 12-21-2013 | |
| 16. | 7.24 ft | on 01-13-2013 | |
| 17. | 12.37 ft | on 06-20-2011 | |
| 18. | 7.60 ft | on 03-05-2011 | |
| 19. | 8.05 ft | on 02-28-2011 | |
| 20. | 9.11 ft | on 06-22-2010 | |
| 21. | 7.67 ft | on 08-04-2009 | |
| 22. | 5.43 ft | on 02-11-2009 | |
| 23. | 8.03 ft | on 02-06-2008 | |
| 24. | 6.72 ft | on 12-31-2006 | |
| 25. | 10.49 ft | on 06-16-2004 | |
| 26. | 6.07 ft | on 06-15-2004 | |
| 27. | 6.34 ft | on 06-11-2004 | |
| 28. | 11.25 ft | on 09-01-2003 | |
| 29. | 7.47 ft | on 06-27-2002 | |
| 30. | 8.18 ft | on 07-18-2001 | |
| 31. | 6.59 ft | on 05-27-2000 | |
| 32. | 6.11 ft | on 01-22-1999 | |
| 33. | 10.76 ft | on 06-14-1998 | |
| 34. | 7.90 ft | on 11-07-1996 | |
| 35. | 10.72 ft | on 05-15-1996 | |
| 36. | 9.88 ft | on 05-14-1995 | |
| 37. | 9.99 ft | on 11-14-1993 | |
| 38. | 7.32 ft | on 11-12-1992 | |
| 39. | 10.87 ft | on 06-18-1992 | |
| 40. | 7.51 ft | on 12-30-1990 | |
| 41. | 8.39 ft | on 03-11-1990 | |
| 42. | 10.44 ft | on 09-14-1989 | |
| 43. | 8.04 ft | on 08-03-1988 | |
| 44. | 11.48 ft | on 10-04-1986 | |
| 45. | 7.52 ft | on 11-19-1985 | |
| 46. | 6.86 ft | on 03-31-1985 | |
| 47. | 8.60 ft | on 07-05-1984 | |
| 48. | 5.83 ft | on 07-14-1983 | |
| 49. | 6.54 ft | on 01-23-1982 | |
| 50. | 7.38 ft | on 05-24-1981 | |
| 51. | 6.23 ft | on 08-19-1980 | |
| 52. | 10.34 ft | on 08-01-1979 | |
| 53. | 13.86 ft | on 06-25-1978 | |
| 54. | 8.27 ft | on 02-26-1977 | |
| 55. | 9.17 ft | on 07-02-1976 | |
| 56. | 7.77 ft | on 02-23-1975 | |
| 57. | 8.40 ft | on 07-22-1974 | |
| 58. | 8.08 ft | on 11-02-1972 | |
| 59. | 7.43 ft | on 04-07-1972 | |
| 60. | 7.06 ft | on 02-04-1971 | |
| 61. | 6.58 ft | on 04-24-1970 | |
| 62. | 9.44 ft | on 07-20-1969 | |
| 63. | 9.36 ft | on 04-04-1968 | |
| 64. | 6.36 ft | on 12-08-1966 | |
| 65. | 4.95 ft | on 02-10-1966 | |
| 66. | 6.69 ft | on 02-09-1965 | |
| 67. | 10.32 ft | on 03-04-1963 | |
| 68. | 6.86 ft | on 03-21-1962 | |
| 69. | 9.49 ft | on 04-25-1961 | |
| 70. | 6.48 ft | on 07-13-1960 | |
| 71. | 16.00 ft | on 05-28-1956 |
Historic Crests
| 1. | 16.00 ft | on 05-28-1956 |
| 2. | 13.86 ft | on 06-25-1978 |
| 3. | 12.37 ft | on 06-20-2011 |
| 4. | 11.48 ft | on 10-04-1986 |
| 5. | 11.33 ft | on 07-26-2015 |
Historic Crests
| 1. | 16.00 ft | on 05-28-1956 | |
| 2. | 13.86 ft | on 06-25-1978 | |
| 3. | 12.37 ft | on 06-20-2011 | |
| 4. | 11.48 ft | on 10-04-1986 | |
| 5. | 11.33 ft | on 07-26-2015 | |
| 6. | 11.26 ft | on 07-07-2015 | |
| 7. | 11.25 ft | on 09-01-2003 | |
| 8. | 10.87 ft | on 06-18-1992 | |
| 9. | 10.76 ft | on 06-14-1998 | |
| 10. | 10.72 ft | on 05-15-1996 | |
| 11. | 10.49 ft | on 06-16-2004 | |
| 12. | 10.44 ft | on 09-14-1989 | |
| 13. | 10.34 ft | on 08-01-1979 | |
| 14. | 10.32 ft | on 03-04-1963 | |
| 15. | 10.20 ft | on 08-26-2016 | (P) |
| 16. | 9.99 ft | on 11-14-1993 | |
| 17. | 9.88 ft | on 05-14-1995 | |
| 18. | 9.78 ft | on 06-26-2015 | |
| 19. | 9.49 ft | on 04-25-1961 | |
| 20. | 9.44 ft | on 07-20-1969 | |
| 21. | 9.36 ft | on 04-04-1968 | |
| 22. | 9.17 ft | on 07-02-1976 | |
| 23. | 9.11 ft | on 06-22-2010 | |
| 24. | 8.72 ft | on 04-03-2018 | (P) |
| 25. | 8.64 ft | on 12-21-2013 | |
| 26. | 8.60 ft | on 07-05-1984 | |
| 27. | 8.55 ft | on 08-24-2016 | (P) |
| 28. | 8.46 ft | on 07-11-2017 | (P) |
| 29. | 8.40 ft | on 07-22-1974 | |
| 30. | 8.39 ft | on 03-11-1990 | |
| 31. | 8.27 ft | on 02-26-1977 | |
| 32. | 8.18 ft | on 07-18-2001 | |
| 33. | 8.08 ft | on 11-02-1972 | |
| 34. | 8.05 ft | on 02-28-2011 | |
| 35. | 8.04 ft | on 08-03-1988 | |
| 36. | 8.03 ft | on 02-06-2008 | |
| 37. | 8.02 ft | on 06-15-2016 | (P) |
| 38. | 7.90 ft | on 11-07-1996 | |
| 39. | 7.77 ft | on 02-23-1975 | |
| 40. | 7.67 ft | on 08-04-2009 | |
| 41. | 7.60 ft | on 03-05-2011 | |
| 42. | 7.60 ft | on 09-08-2018 | |
| 43. | 7.52 ft | on 11-19-1985 | |
| 44. | 7.51 ft | on 12-30-1990 | |
| 45. | 7.47 ft | on 06-27-2002 | |
| 46. | 7.43 ft | on 04-07-1972 | |
| 47. | 7.39 ft | on 12-27-2015 | (P) |
| 48. | 7.38 ft | on 05-24-1981 | |
| 49. | 7.32 ft | on 11-12-1992 | |
| 50. | 7.28 ft | on 06-23-2017 | (P) |
| 51. | 7.24 ft | on 01-13-2013 | |
| 52. | 7.06 ft | on 02-04-1971 | |
| 53. | 6.87 ft | on 04-30-2017 | (P) |
| 54. | 6.86 ft | on 03-21-1962 | |
| 55. | 6.86 ft | on 06-30-2017 | (P) |
| 56. | 6.86 ft | on 03-31-1985 | |
| 57. | 6.72 ft | on 12-31-2006 | |
| 58. | 6.69 ft | on 02-09-1965 | |
| 59. | 6.59 ft | on 05-27-2000 | |
| 60. | 6.58 ft | on 04-24-1970 | |
| 61. | 6.54 ft | on 01-23-1982 | |
| 62. | 6.48 ft | on 07-13-1960 | |
| 63. | 6.36 ft | on 12-08-1966 | |
| 64. | 6.34 ft | on 06-11-2004 | |
| 65. | 6.23 ft | on 08-19-1980 | |
| 66. | 6.11 ft | on 01-22-1999 | |
| 67. | 6.07 ft | on 06-15-2004 | |
| 68. | 6.01 ft | on 02-24-2018 | (P) |
| 69. | 5.83 ft | on 07-14-1983 | |
| 70. | 5.43 ft | on 02-11-2009 | |
| 71. | 4.95 ft | on 02-10-1966 |
Vertical Datum Table
| type | NAVD88 |
|---|---|
| major Flooding | 792.45 ft |
| moderate Flooding | 789.45 ft |
| minor Flooding | 787.45 ft |
| action | 785.45 ft |
| Latest Value | 782.63 ft |
| Gauge Zero | 779.45 ft |


Probability Information
No Images Available
Collaborative Agencies
The National Weather Service prepares its forecasts and other services in collaboration with agencies like the US Geological Survey, US Bureau of Reclamation, US Army Corps of Engineers, Natural Resource Conservation Service, National Park Service, ALERT Users Group, Bureau of Indian Affairs, and many state and local emergency managers across the country. For details, please click here.
Resources
Hydrologic Resource Links
- River Forecast Centers
- Text Products
- Forecast Precipitation
- US Geological Survey Surface Water
- How to Use US Geological Survey Water Alert Feature
- Water Resources Outlook
- Wabash River Conservation Area
- Water flow from Norway and Oakdale Dams
- Indianapolis Reservoir Levels
- Midwest Region U.S. Drought Monitor
- Indianapolis Museum of Art: FLOW Can You See the River?
- The Flood of 1913 - Remembered
- Friends of the White River
Additional Resource Links
- NWS Precipitation and River Forecasting
- Area Hydrographs
- Zoomable RFC Hourly Precipitation Maps
- Zoomable Snowfall Maps
- Indiana State Climate Office
- Community Collaborative Rain, Hail & Snow Network in Indiana
- Snow Information
- Midwestern Regional Climate Center
- Indiana Precipitation Frequencies
- Drainage Areas of Indiana Streams
- Ensemble River Forecasts
- Ohio River Forecast Center