William Locke Drain near Durbin
Future / Actual / Minor
OWP 2.0 WWA Modal Title
01/11/2021, 10:04 PM UTC through 01/11/2021, 10:04 PM UTC
Sender
Sent
- Upstream gauge unavailableWarning: no valid ratings curve available. Transformations to and from FEET/CFS/KCFS will not happen.No secondary data available. Transformations for Flow data and a secondary Y axis cannot be made at this time.
Traces and Thresholds Click to turn on/off display
Observed (OBS) 04/01/2025 10:00 AM EDTCATEGORY STAGE 
Major Flooding 15 ft Moderate Flooding 13.5 ft Minor Flooding 12 ft Action 10 ft Reliability of the Forecast:
NOTE: Forecasts are not available. Only observed stages are available for this point.
National Water Model Hydrograph
Official NWS streamflow forecasts are produced by NWS hydrologic forecasters for river gauge locations using hydrologic models which are calibrated to that location. This process considers additional guidance and information, including local expertise and experience, to produce the best forecast possible. The NWM output provides supplemental guidance to NWS forecasters and should not be considered an official NWS river forecast.
Flood Impacts
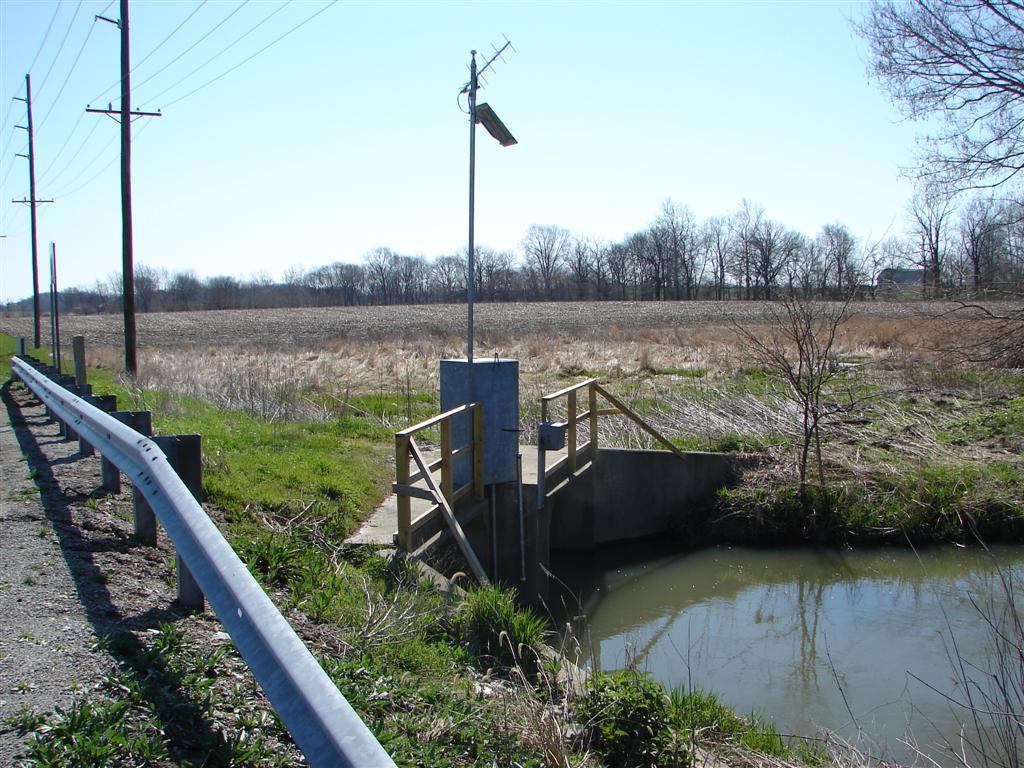
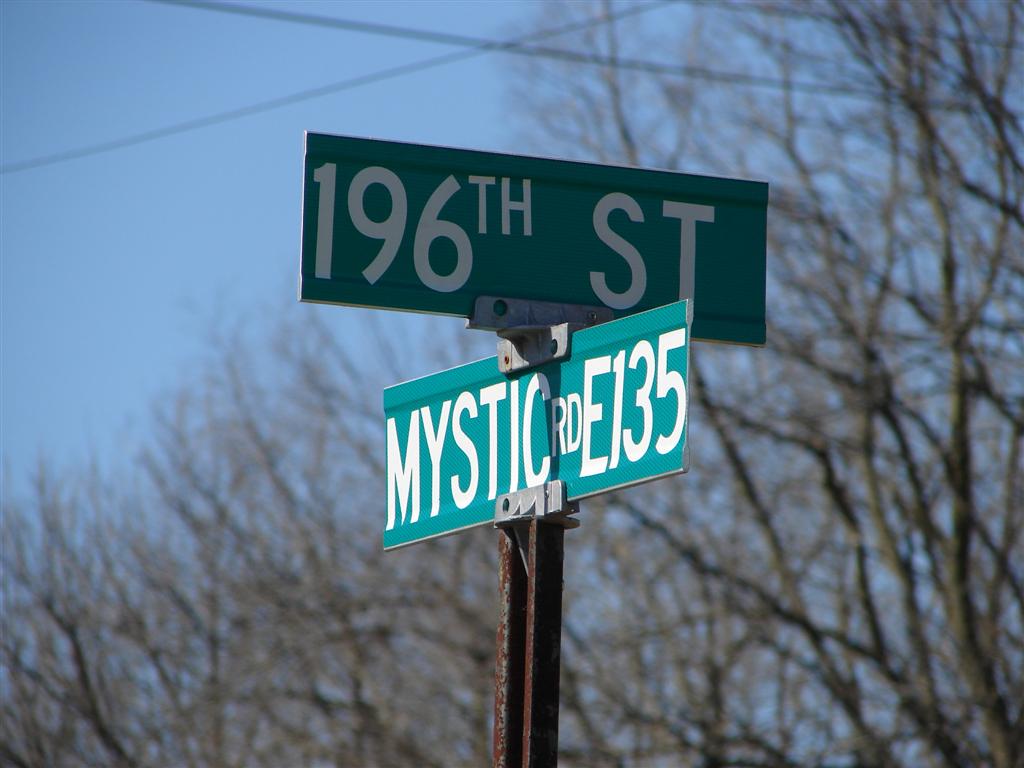
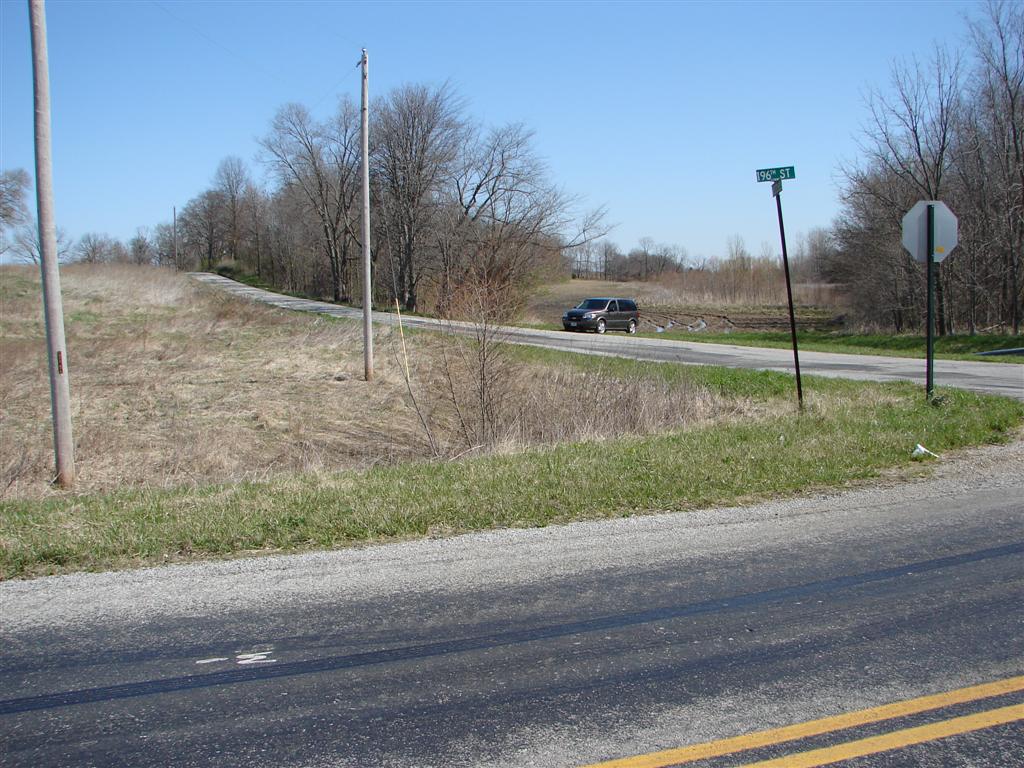
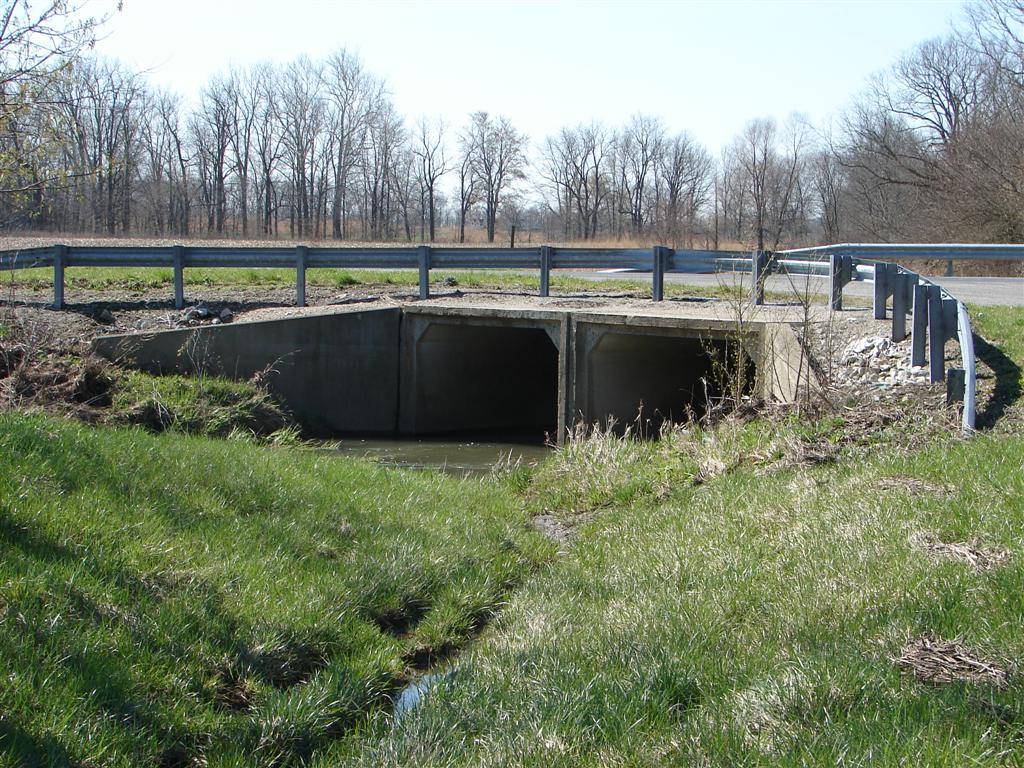
- 15 - Major local flooding in progress. Water level significantly higher on north side of 196th Street than south side. Water possiblly approaching the north side of 196th Street near Mystic Road. Extensive flooding of the west bank of William Lock Ditch south of 196th Street. Water nearly two feet deep around gaging site.
- 14 - Extensive local flooding in progress. Water is higher on the north side of 196th street than the south side as openings are full. Extensive flooding especially of west bank of William Lock Ditch. Water surrounds gaging station.
- 13 - The openings under 196th Street are full. Water spilling out of William Lock Ditch especially the west bank both north and south of 196th Street.
Gauge Info
| Coordinates | 40.0736, -85.9250 |
| RFC | OHRFC |
| State | IN |
| WFO | IND |
| County | Hamilton |
| Data Provider(s) | |
| US Geological Survey | USGS--Water Resources of the United States |
| USGS | 03350660 |
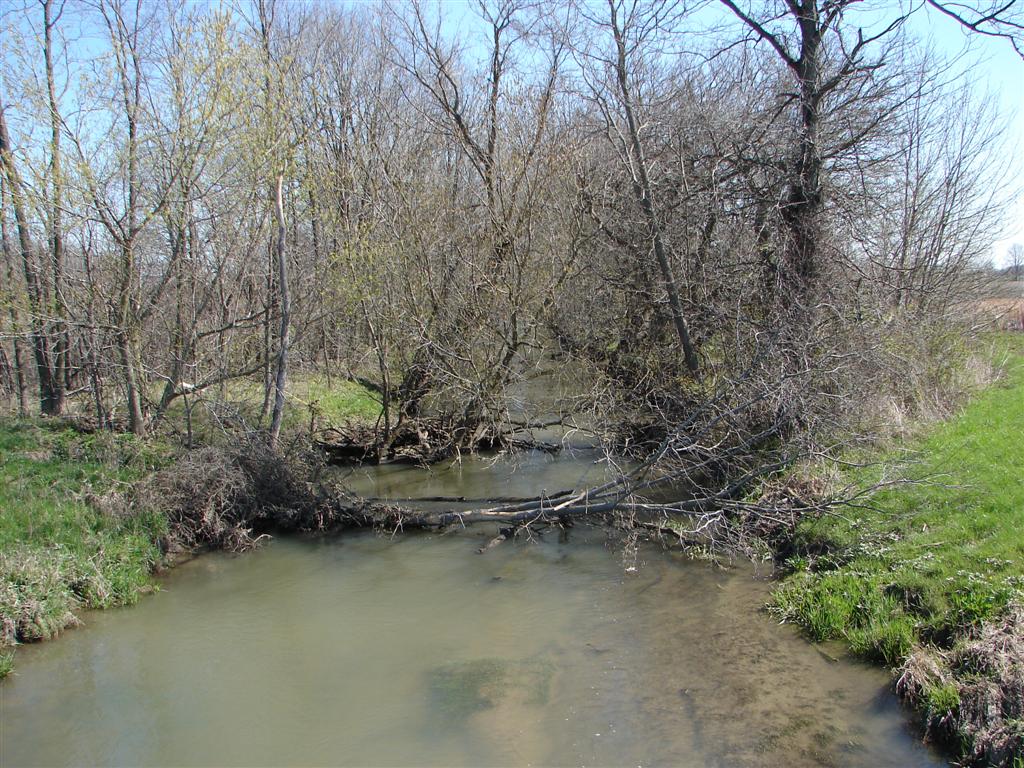
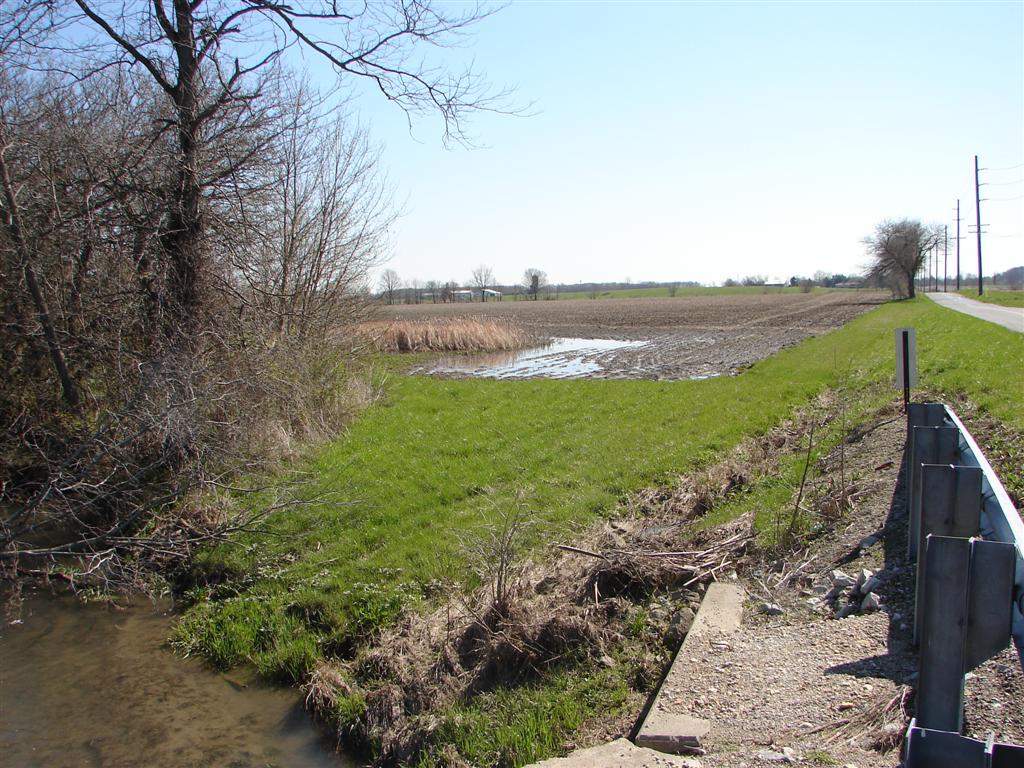
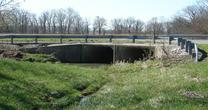
Gauge Location
Recent Crests
| 1. | 12.33 ft | on 10-25-2021 | (P) |
| 2. | 12.61 ft | on 03-18-2021 | (P) |
| 3. | 13.21 ft | on 03-29-2020 | (P) |
| 4. | 12.02 ft | on 04-26-2019 | |
| 5. | 12.64 ft | on 04-03-2018 | (P) |
Recent Crests
| 1. | 12.33 ft | on 10-25-2021 | (P) |
| 2. | 12.61 ft | on 03-18-2021 | (P) |
| 3. | 13.21 ft | on 03-29-2020 | (P) |
| 4. | 12.02 ft | on 04-26-2019 | |
| 5. | 12.64 ft | on 04-03-2018 | (P) |
| 6. | 11.05 ft | on 02-25-2018 | (P) |
| 7. | 12.65 ft | on 11-18-2017 | (P) |
| 8. | 11.82 ft | on 11-06-2017 | (P) |
| 9. | 13.43 ft | on 07-08-2017 | (P) |
| 10. | 9.71 ft | on 07-01-2017 | (P) |
| 11. | 12.27 ft | on 06-23-2017 | (P) |
| 12. | 11.21 ft | on 06-18-2017 | (P) |
| 13. | 13.21 ft | on 05-04-2017 | (P) |
| 14. | 9.48 ft | on 03-31-2017 | (P) |
| 15. | 12.54 ft | on 12-27-2015 | (P) |
| 16. | 13.20 ft | on 06-27-2015 | |
| 17. | 13.09 ft | on 04-03-2014 | |
| 18. | 12.39 ft | on 12-22-2013 | |
| 19. | 12.95 ft | on 04-19-2013 | |
| 20. | 13.01 ft | on 01-13-2013 | |
| 21. | 12.90 ft | on 03-05-2011 | |
| 22. | 13.56 ft | on 02-28-2011 | |
| 23. | 13.69 ft | on 06-22-2010 | |
| 24. | 12.34 ft | on 02-11-2009 |
Historic Crests
| 1. | 13.69 ft | on 06-22-2010 | |
| 2. | 13.56 ft | on 02-28-2011 | |
| 3. | 13.43 ft | on 07-08-2017 | (P) |
| 4. | 13.21 ft | on 05-04-2017 | (P) |
| 5. | 13.21 ft | on 03-29-2020 | (P) |
Historic Crests
| 1. | 13.69 ft | on 06-22-2010 | |
| 2. | 13.56 ft | on 02-28-2011 | |
| 3. | 13.43 ft | on 07-08-2017 | (P) |
| 4. | 13.21 ft | on 05-04-2017 | (P) |
| 5. | 13.21 ft | on 03-29-2020 | (P) |
| 6. | 13.20 ft | on 06-27-2015 | |
| 7. | 13.09 ft | on 04-03-2014 | |
| 8. | 13.01 ft | on 01-13-2013 | |
| 9. | 12.95 ft | on 04-19-2013 | |
| 10. | 12.90 ft | on 03-05-2011 | |
| 11. | 12.65 ft | on 11-18-2017 | (P) |
| 12. | 12.64 ft | on 04-03-2018 | (P) |
| 13. | 12.61 ft | on 03-18-2021 | (P) |
| 14. | 12.54 ft | on 12-27-2015 | (P) |
| 15. | 12.39 ft | on 12-22-2013 | |
| 16. | 12.34 ft | on 02-11-2009 | |
| 17. | 12.33 ft | on 10-25-2021 | (P) |
| 18. | 12.27 ft | on 06-23-2017 | (P) |
| 19. | 12.02 ft | on 04-26-2019 | |
| 20. | 11.82 ft | on 11-06-2017 | (P) |
| 21. | 11.21 ft | on 06-18-2017 | (P) |
| 22. | 11.05 ft | on 02-25-2018 | (P) |
| 23. | 9.71 ft | on 07-01-2017 | (P) |
| 24. | 9.48 ft | on 03-31-2017 | (P) |
Low Water Records
Low Water Records
Vertical Datum Table
| type | NAVD88 |
|---|---|
| major Flooding | 786.00 ft |
| moderate Flooding | 784.50 ft |
| minor Flooding | 783.00 ft |
| action | 781.00 ft |
| Latest Value | 777.44 ft |
| Gauge Zero | 771.00 ft |


Probability Information
No Images Available
Collaborative Agencies
The National Weather Service prepares its forecasts and other services in collaboration with agencies like the US Geological Survey, US Bureau of Reclamation, US Army Corps of Engineers, Natural Resource Conservation Service, National Park Service, ALERT Users Group, Bureau of Indian Affairs, and many state and local emergency managers across the country. For details, please click here.
Resources
Hydrologic Resource Links
- River Forecast Centers
- Text Products
- Forecast Precipitation
- US Geological Survey Surface Water
- How to Use US Geological Survey Water Alert Feature
- Water Resources Outlook
- Wabash River Conservation Area
- Water flow from Norway and Oakdale Dams
- Indianapolis Reservoir Levels
- Midwest Region U.S. Drought Monitor
- Indianapolis Museum of Art: FLOW Can You See the River?
- The Flood of 1913 - Remembered
- Friends of the White River
Additional Resource Links
- NWS Precipitation and River Forecasting
- Area Hydrographs
- Zoomable RFC Hourly Precipitation Maps
- Zoomable Snowfall Maps
- Indiana State Climate Office
- Community Collaborative Rain, Hail & Snow Network in Indiana
- Snow Information
- Midwestern Regional Climate Center
- Indiana Precipitation Frequencies
- Drainage Areas of Indiana Streams
- Ensemble River Forecasts
- Ohio River Forecast Center