Latitude/Longitude Disclaimer: The gauge location shown in the above map is the approximate location based on the latitude/longitude coordinates provided to the NWS by the gauge owner.
Gauge Information
Map Overlays
FEMA's National Flood Hazard Layers not showing?
Why aren't the FEMA National Flood Hazard Layers showing on the ESRI Map?
Possible reasons:
There are no FEMA National Flood Hazard Layers for the location which you are viewing on ESRI Maps.
The FEMA Web Mapping Service (WMS) is down.
Note: Your zoom level may have changed. ESRI's zoom levels must be between 14 and 16 to show National Flood Hazard layers.
Note: Your zoom level may have changed. ESRI's zoom levels must be between 14 and 16 to show National Flood Hazard layers.
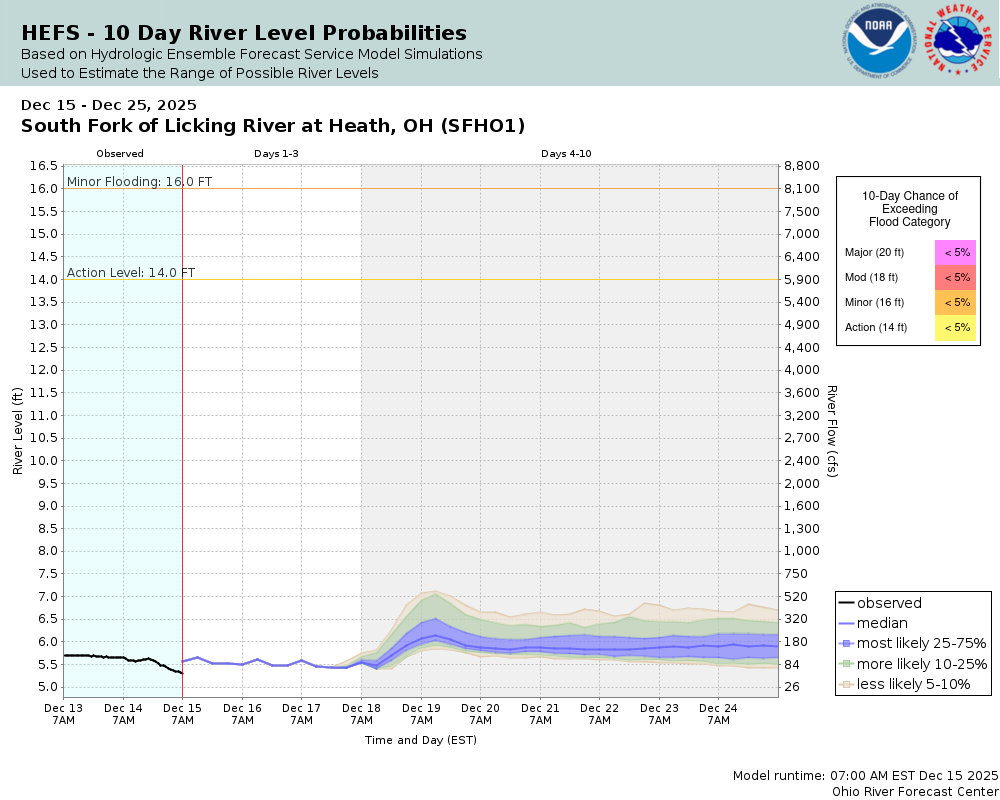
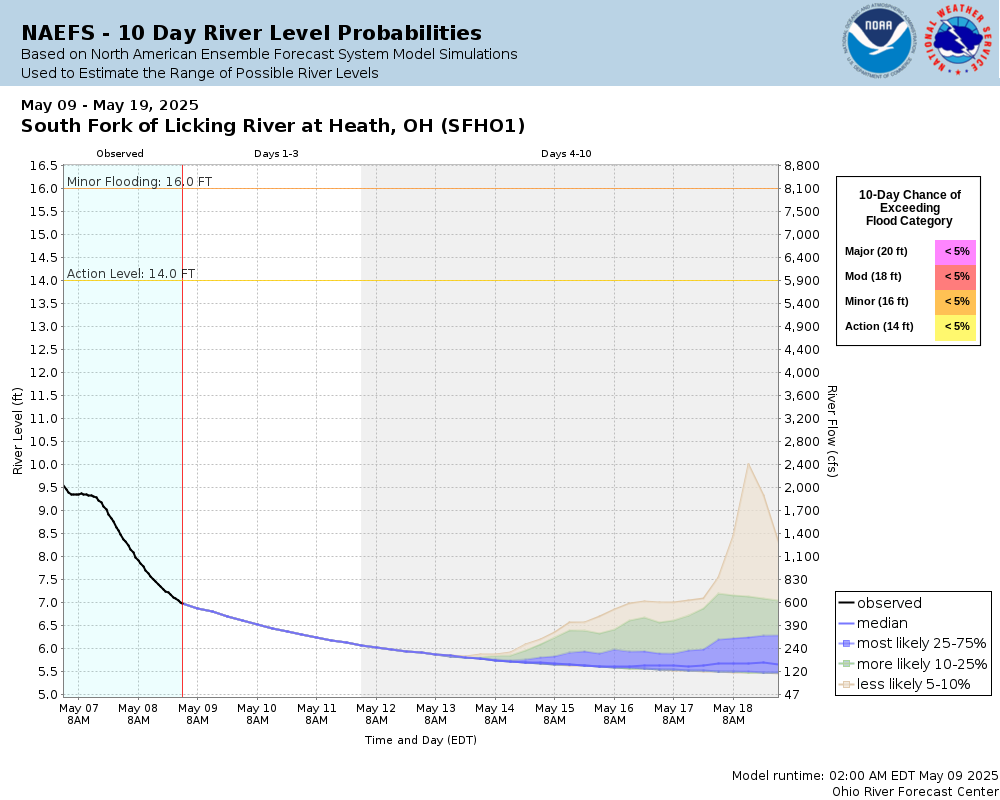
Flood Categories (in feet)
Major Flood Stage:
20
Moderate Flood Stage:
18
Flood Stage:
16
Action Stage:
14
Low Stage (in feet):
-9999
Historic Crests
(1) 21.06 ft on 03/20/2020 (P)
(2) 17.79 ft on 07/13/2017
(3) 17.59 ft on 03/15/2012
(4) 16.52 ft on 02/18/2022 (P)
(5) 13.56 ft on 07/02/2014
(P): Preliminary values subject to further review.
Recent Crests
(1) 16.52 ft on 02/18/2022 (P)
(2) 21.06 ft on 03/20/2020 (P)
(3) 17.79 ft on 07/13/2017
(4) 13.56 ft on 07/02/2014
(5) 17.59 ft on 03/15/2012
(P): Preliminary values subject to further review.
Low Water Records Currently none available.
Graphical representation of flood inundation for NWS flood categories are based on steady state hydraulic modeling of water surface elevations for incremented discharges. Map shows approximate inundation areas for given water surface elevations and should not be used for navigation or permitting or other legal purposes, but strictly as a planning reference tool.
Extended rating: The Rating Curve Extension is calculated by using either a linear, logarithmic, or hydraulic technique to extend the rating curve above the currently established relationship between stage and flow.
Flood Impacts
If you notice any errors in the below information, please contact our Webmaster
22
Widespread flooding of homes occurs along Licking View Drive and several adjacent subdivisions, as well as some flooding of homes along and near Irving Wick Drive East. Significant flooding of homes along and near Amber Lane occurs. Flooding of about half of Holly Park Estates occurs.
21
Water at least one foot deep affects all but the northern extent of Glenwood subdivision, as well as Huron Drive West, Livingston Court, with some water affecting Huron Drive. Most of Licking View Drive is under water with several homes along Licking View near Creekview Drive flooded. Homes along Hopewell are flooded. Homes along and near Amber Lane are flooded, with water approaching homes from a flooded Irving Wick Drive East. Homes along Holly Park Drive and Roberston Drive Southeast are flooded.
20
This is very close to the FEMA 1 percent flood. Extensive flooding along Licking View Drive, with water reaching to several homes within the Glenwood subdivision area along Woodsedge Circle, Hillview and Wildwood Courts. Most of Huron Drive West, some of Huron Drive, and Creekview Drives are affected. Homes along Hopewell Drive incur flooding, as well as Roberston Drive SE and Holly Park Estates. Water covers portions of Irving Wick Drive East and the southeast side of the Heath High Stadium.
19
Much of Licking View Drive is flooded, with water approaching homes along Licking View near Creekview Drive. Homes are impacted near Hillview Court, Huron Drive West, Livingston Court and Wildwood Court. Irving Wick Drive East is flooded near the river. Hoback Park and Forry Reserve are covered by several feet of water. Robertson Drive Southeast is flooded, as well as Holly Park Estate.
18
Water covers properties along Licking View Drive, especially near Hopewell Drive. Several properties along Licking View Drive are flooded, though no structures are flooded. Portions of South Fork Road near Irving Wick Drive are flooded, as well as Hobak Park and Forry Preserve, with water crossing Licking View Drive and approaching the football stadium behind Heath High School.
17
Some areas of Licking View Drive near Livingston Court are flooded. The soccer and baseball fields of Hobak Park are also flooded.
16
Water inundates low areas of Hobak Park and approaches portions of Licking View Drive.
The National Weather Service prepares its forecasts and other services in collaboration with agencies like the US Geological Survey, US Bureau of Reclamation, US Army Corps of Engineers, Natural Resource Conservation Service, National Park Service, ALERT Users Group, Bureau of Indian Affairs, and many state and local emergency managers across the country. For details, please click here.
Graphical representation of flood inundation for NWS flood categories are based on steady state hydraulic modeling of water surface elevations for incremented discharges. Map shows approximate inundation areas for given water surface elevations and should not be used for navigation or permitting or other legal purposes, but strictly as a planning reference tool.