Little River at Manchester
Future / Actual / Minor
OWP 2.0 WWA Modal Title
01/11/2021, 10:04 PM UTC through 01/11/2021, 10:04 PM UTC
Sender
Sent
- Warning: no valid ratings curve available. Transformations to and from FEET/CFS/KCFS will not happen.
Traces and Thresholds Click to turn on/off display
Observed (OBS) 06/27/2025 10:30 PM EDTRecord: 38.3 ftCATEGORY STAGE 
Major Flooding 27 ft Moderate Flooding 24 ft Minor Flooding 18 ft Action 18 ft Reliability of the Forecast:
NOTE: Forecasts are issued as needed during times of high water, but are not routinely available.
National Water Model Hydrograph
Official NWS streamflow forecasts are produced by NWS hydrologic forecasters for river gauge locations using hydrologic models which are calibrated to that location. This process considers additional guidance and information, including local expertise and experience, to produce the best forecast possible. The NWM output provides supplemental guidance to NWS forecasters and should not be considered an official NWS river forecast.
Flood Impacts
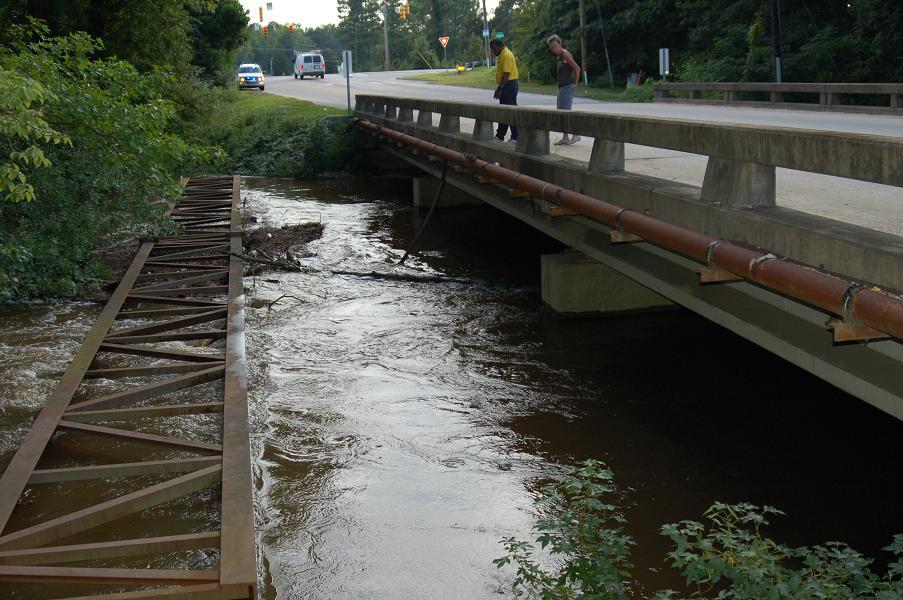
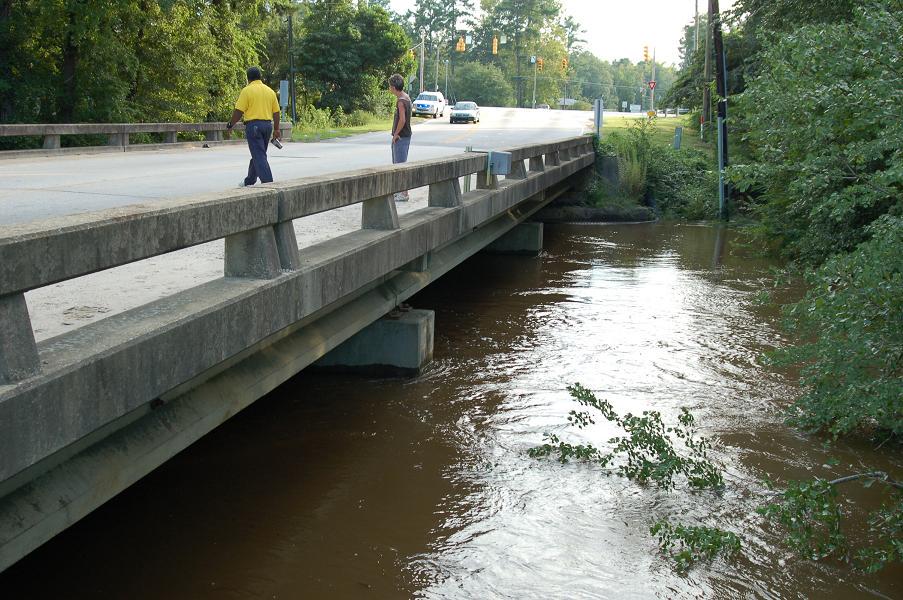
- 37 - Flooding reaches the road level of the Bragg Blvd (Hwy 24/87) bridge over the Little River. Local businesses will be flooded.
- 30 - Water reaches the base of the Bragg Blvd (Hwy 24/87) bridge across the Little River.
- 28 - Flooding reaches the road surface of the Manchester Road bridge.
Gauge Info
| Coordinates | 35.1936, -78.9856 |
| RFC | SERFC |
| State | NC |
| WFO | RAH |
| County | Cumberland |
| Data Provider(s) | |
| US Geological Survey | USGS--Water Resources of the United States |
| USGS | 02103000 |
Gauge Location
Recent Crests
| 1. | 27.71 ft | on 08-10-2024 | (P) |
| 2. | 20.61 ft | on 02-21-2021 | (P) |
| 3. | 18.23 ft | on 02-16-2021 | (P) |
| 4. | 21.86 ft | on 01-31-2020 | |
| 5. | 24.79 ft | on 11-15-2018 |
Recent Crests
| 1. | 27.71 ft | on 08-10-2024 | (P) |
| 2. | 20.61 ft | on 02-21-2021 | (P) |
| 3. | 18.23 ft | on 02-16-2021 | (P) |
| 4. | 21.86 ft | on 01-31-2020 | |
| 5. | 24.79 ft | on 11-15-2018 | |
| 6. | 17.26 ft | on 10-14-2018 | |
| 7. | 38.30 ft | on 09-18-2018 | |
| 8. | 32.19 ft | on 10-10-2016 | |
| 9. | 31.36 ft | on 10-09-2016 | |
| 10. | 31.20 ft | on 09-29-2016 | |
| 11. | 20.23 ft | on 02-08-2010 | |
| 12. | 18.80 ft | on 06-16-2006 | |
| 13. | 18.26 ft | on 09-10-2004 | |
| 14. | 24.72 ft | on 08-11-2003 | |
| 15. | 11.20 ft | on 10-10-1949 | |
| 16. | 29.00 ft | on 09-19-1945 | |
| 17. | 11.70 ft | on 08-21-1942 | |
| 18. | 12.28 ft | on 04-07-1941 | |
| 19. | 12.77 ft | on 03-03-1939 |
Historic Crests
| 1. | 38.30 ft | on 09-18-2018 |
| 2. | 32.19 ft | on 10-10-2016 |
| 3. | 31.36 ft | on 10-09-2016 |
| 4. | 31.20 ft | on 09-29-2016 |
| 5. | 29.00 ft | on 09-19-1945 |
Historic Crests
| 1. | 38.30 ft | on 09-18-2018 | |
| 2. | 32.19 ft | on 10-10-2016 | |
| 3. | 31.36 ft | on 10-09-2016 | |
| 4. | 31.20 ft | on 09-29-2016 | |
| 5. | 29.00 ft | on 09-19-1945 | |
| 6. | 27.71 ft | on 08-10-2024 | (P) |
| 7. | 24.79 ft | on 11-15-2018 | |
| 8. | 24.72 ft | on 08-11-2003 | |
| 9. | 21.86 ft | on 01-31-2020 | |
| 10. | 20.61 ft | on 02-21-2021 | (P) |
| 11. | 20.23 ft | on 02-08-2010 | |
| 12. | 18.80 ft | on 06-16-2006 | |
| 13. | 18.26 ft | on 09-10-2004 | |
| 14. | 18.23 ft | on 02-16-2021 | (P) |
| 15. | 17.26 ft | on 10-14-2018 | |
| 16. | 12.77 ft | on 03-03-1939 | |
| 17. | 12.28 ft | on 04-07-1941 | |
| 18. | 11.70 ft | on 08-21-1942 | |
| 19. | 11.20 ft | on 10-10-1949 |
Vertical Datum Table
| type | NAVD88 |
|---|---|
| major Flooding | 149.83 ft |
| moderate Flooding | 146.83 ft |
| minor Flooding | 140.83 ft |
| action | 140.83 ft |
| Latest Value | 129.38 ft |
| Gauge Zero | 122.83 ft |

Unique Local Info
|
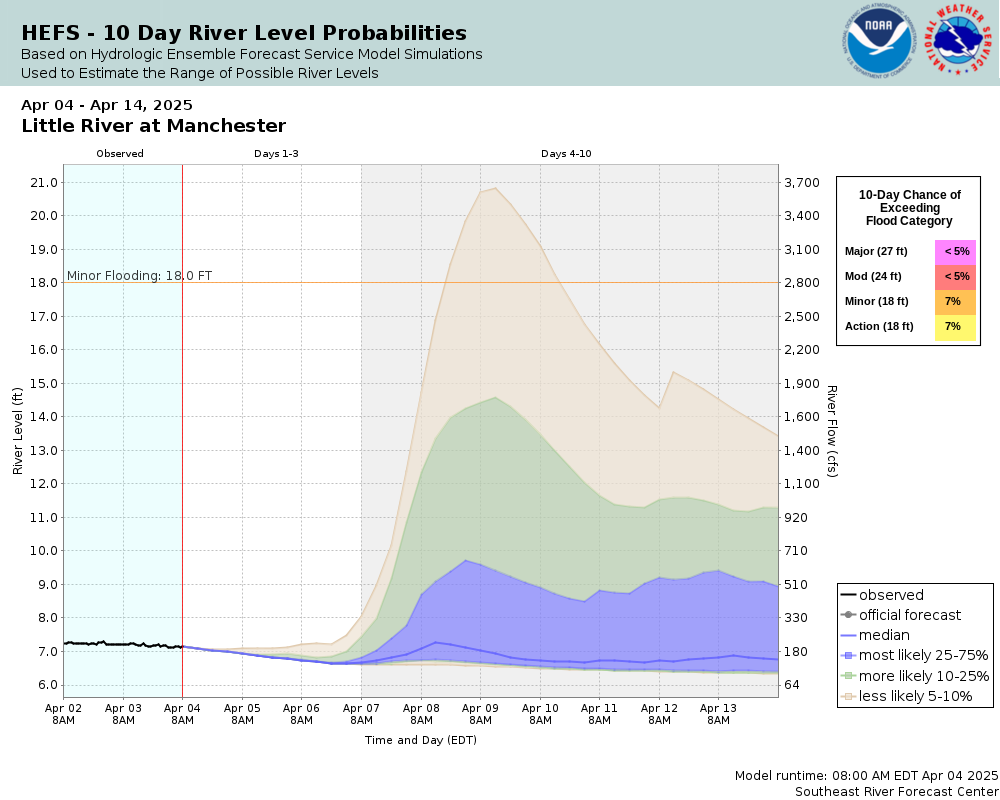
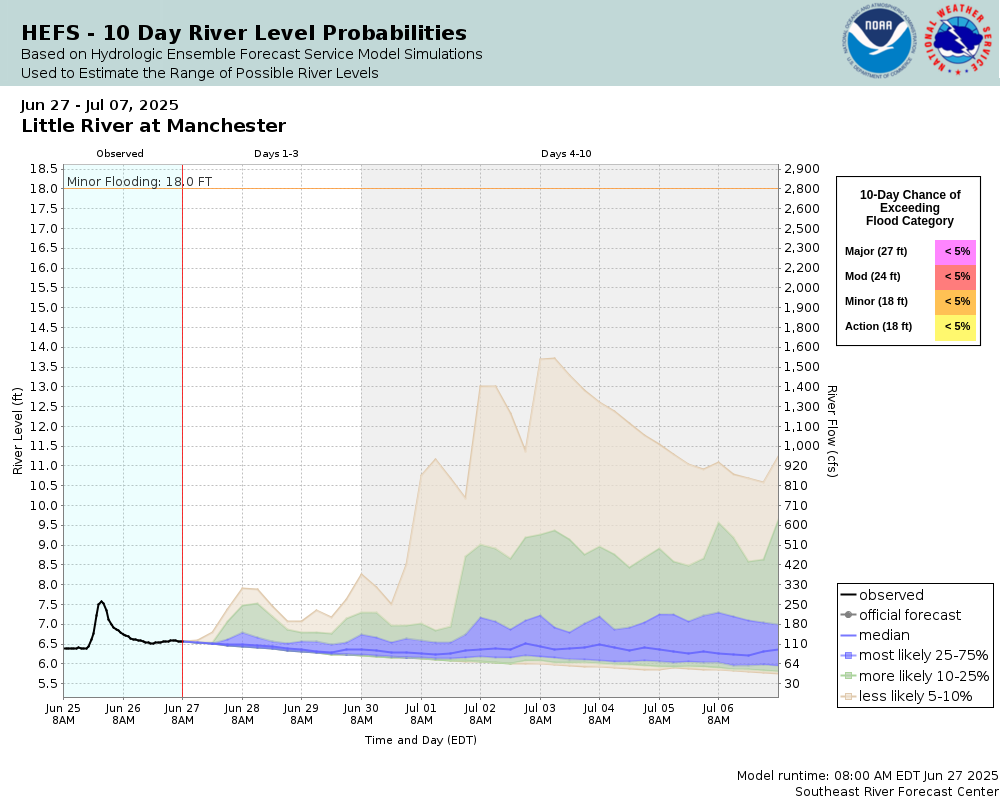
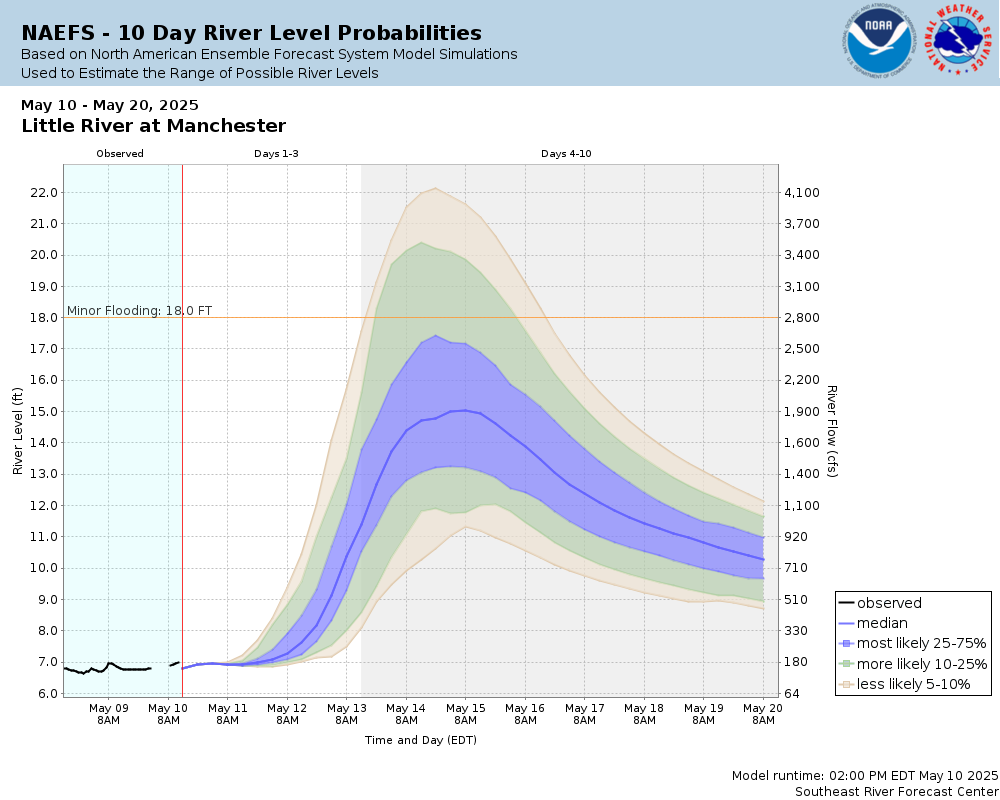
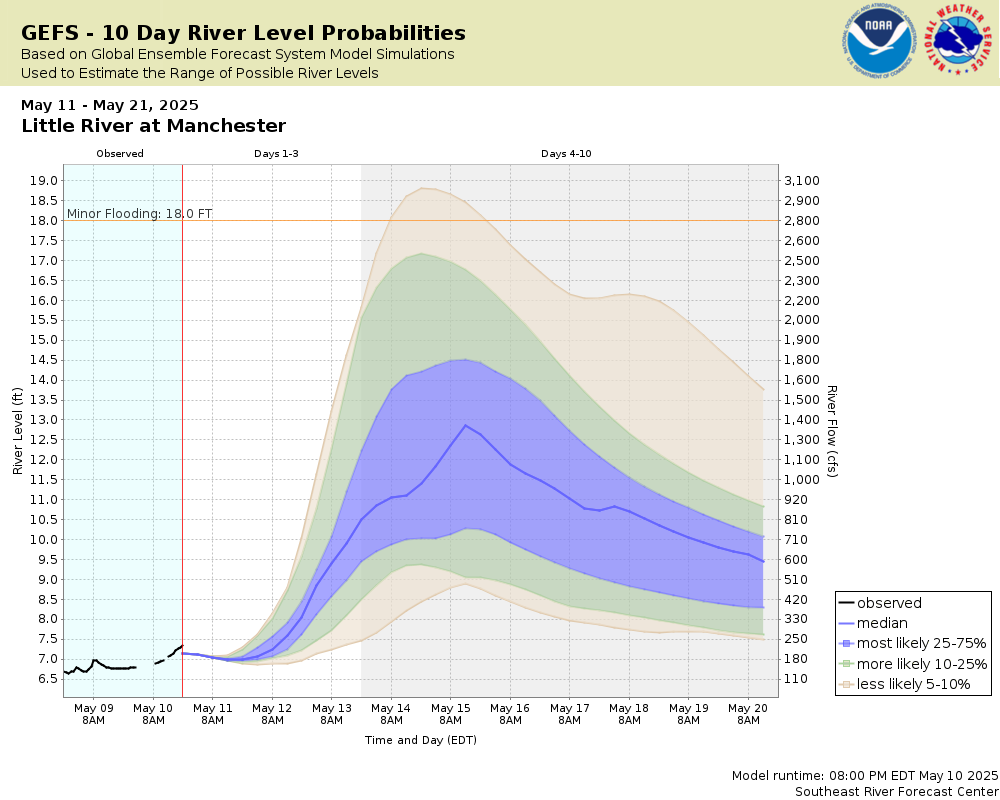
Potential River Levels Used to Estimate the Chance of Flooding and the Range of Possible River Levels |
||
| 10 Day (HEFS) | 10 Day (NAEFS) | 10 Day (GEFS) |
 |
 |
 |
Note: Use the official hydrograph at the top of this web page for river levels within the next 72 Hours.
Collaborative Agencies
The National Weather Service prepares its forecasts and other services in collaboration with agencies like the US Geological Survey, US Bureau of Reclamation, US Army Corps of Engineers, Natural Resource Conservation Service, National Park Service, ALERT Users Group, Bureau of Indian Affairs, and many state and local emergency managers across the country. For details, please click here.