Shawsheen River at Andover
Future / Actual / Minor
OWP 2.0 WWA Modal Title
01/11/2021, 10:04 PM UTC through 01/11/2021, 10:04 PM UTC
Sender
Sent
- Upstream gauge unavailableDownstream gauge unavailableWarning: no valid ratings curve available. Transformations to and from FEET/CFS/KCFS will not happen.
Traces and Thresholds Click to turn on/off display
Observed (OBS) 06/10/2025 10:45 PM EDTOfficial Forecast (FCST) 06/10/2025 11:57 AM EDTCATEGORY STAGE 
Major Flooding 35 ft Moderate Flooding 32 ft Minor Flooding 29 ft Action 28 ft Reliability of the Forecast:
NOTE: Forecasts are issued routinely year-round.
The Merrimack River can produce substantial backwater flooding into the lower Shawsheen River in Lawrence, North Andover, and Andover. Please utilize the info from our Lawrence location in conjunction the Andover location for flood forecasts and warnings.
National Water Model Hydrograph
Official NWS streamflow forecasts are produced by NWS hydrologic forecasters for river gauge locations using hydrologic models which are calibrated to that location. This process considers additional guidance and information, including local expertise and experience, to produce the best forecast possible. The NWM output provides supplemental guidance to NWS forecasters and should not be considered an official NWS river forecast.
Flood Impacts
- 38 - Flood impacts are expected to be comparable to, or worse than, the May 2006 Floods. Impacts in North Andover will increase along Glenwood, Fernwood and Elmwood Streets, and both Mass Ave and Route 114 experience significant flooding at the Lawrence-North Andover Town line. Floodwaters impact large sections of Andover in the greater vicinity of North Main Street. Numerous residences, businesses and roadways are impacted.
- 36 - In Andover, a stretch of North Main Street is impassable. Floodwaters inundate numerous residences and businesses in the greater vicinity of North Main. Impacted areas include but are not limited to Washington Park Condominiums, the Balmoral, Shawsheen Plaza, Powdermill Square, Ballardvale Falls, Gradall Lane and River Street. Flooding impacts Mass Ave underpass and businesses on Route 114 at the Lawrence/North Andover town line. In North Andover lower Glenwood, Elmwood and Fernwood Streets are impacted.
- 35 - In North Andover floodwaters inundate lowest lying homes along Glenwood, Elmwood and Fernwood Streets. Floodwaters impact lowest lying businesses and parking lots along Route 114 and Mass Ave on the Lawrence-North Andover town line. In Andover, flood impacts spread to multiple locations along and off of North Main Street, including homes and businesses. Flood impact areas include but are not limited to Washington Park Condominiums, Shawsheen Plaza, Powdermill Square, Ballardvale Falls, and River Street.
Gauge Info
| Coordinates | 42.6715, -71.1492 |
| RFC | NERFC |
| State | MA |
| WFO | BOX |
| County | Essex |
| Data Provider(s) | |
| US Geological Survey | USGS--Water Resources of the United States |
| USGS | 01100627 |
Gauge Location
Recent Crests
| 1. | 28.83 ft | on 04-06-2024 |
| 2. | 28.50 ft | on 03-30-2024 |
| 3. | 28.20 ft | on 03-25-2024 |
| 4. | 30.84 ft | on 01-12-2024 |
| 5. | 30.80 ft | on 12-20-2023 |
Recent Crests
| 1. | 28.83 ft | on 04-06-2024 |
| 2. | 28.50 ft | on 03-30-2024 |
| 3. | 28.20 ft | on 03-25-2024 |
| 4. | 30.84 ft | on 01-12-2024 |
| 5. | 30.80 ft | on 12-20-2023 |
| 6. | 29.09 ft | on 09-21-2023 |
| 7. | 29.37 ft | on 03-16-2023 |
| 8. | 29.21 ft | on 09-04-2021 |
| 9. | 25.85 ft | on 12-17-2020 |
| 10. | 29.90 ft | on 12-11-2014 |
| 11. | 30.56 ft | on 04-01-2014 |
| 12. | 29.68 ft | on 03-08-2011 |
| 13. | 33.98 ft | on 04-01-2010 |
| 14. | 36.16 ft | on 03-16-2010 |
| 15. | 29.59 ft | on 12-14-2008 |
| 16. | 29.09 ft | on 03-10-2008 |
| 17. | 34.15 ft | on 04-18-2007 |
| 18. | 37.45 ft | on 05-15-2006 |
| 19. | 37.45 ft | on 05-15-2006 |
Historic Crests
| 1. | 37.45 ft | on 05-15-2006 |
| 2. | 37.45 ft | on 05-15-2006 |
| 3. | 36.16 ft | on 03-16-2010 |
| 4. | 34.15 ft | on 04-18-2007 |
| 5. | 33.98 ft | on 04-01-2010 |
Historic Crests
| 1. | 37.45 ft | on 05-15-2006 |
| 2. | 37.45 ft | on 05-15-2006 |
| 3. | 36.16 ft | on 03-16-2010 |
| 4. | 34.15 ft | on 04-18-2007 |
| 5. | 33.98 ft | on 04-01-2010 |
| 6. | 30.84 ft | on 01-12-2024 |
| 7. | 30.80 ft | on 12-20-2023 |
| 8. | 30.56 ft | on 04-01-2014 |
| 9. | 29.90 ft | on 12-11-2014 |
| 10. | 29.68 ft | on 03-08-2011 |
| 11. | 29.59 ft | on 12-14-2008 |
| 12. | 29.37 ft | on 03-16-2023 |
| 13. | 29.21 ft | on 09-04-2021 |
| 14. | 29.09 ft | on 03-10-2008 |
| 15. | 29.09 ft | on 09-21-2023 |
| 16. | 28.83 ft | on 04-06-2024 |
| 17. | 28.50 ft | on 03-30-2024 |
| 18. | 28.20 ft | on 03-25-2024 |
| 19. | 25.85 ft | on 12-17-2020 |
Vertical Datum Table
| type | NAVD88 |
|---|---|
| major Flooding | 69.20 ft |
| moderate Flooding | 66.20 ft |
| minor Flooding | 63.20 ft |
| action | 62.20 ft |
| Latest Value | 59.65 ft |
| Gauge Zero | 34.20 ft |


Unique Local Info
|
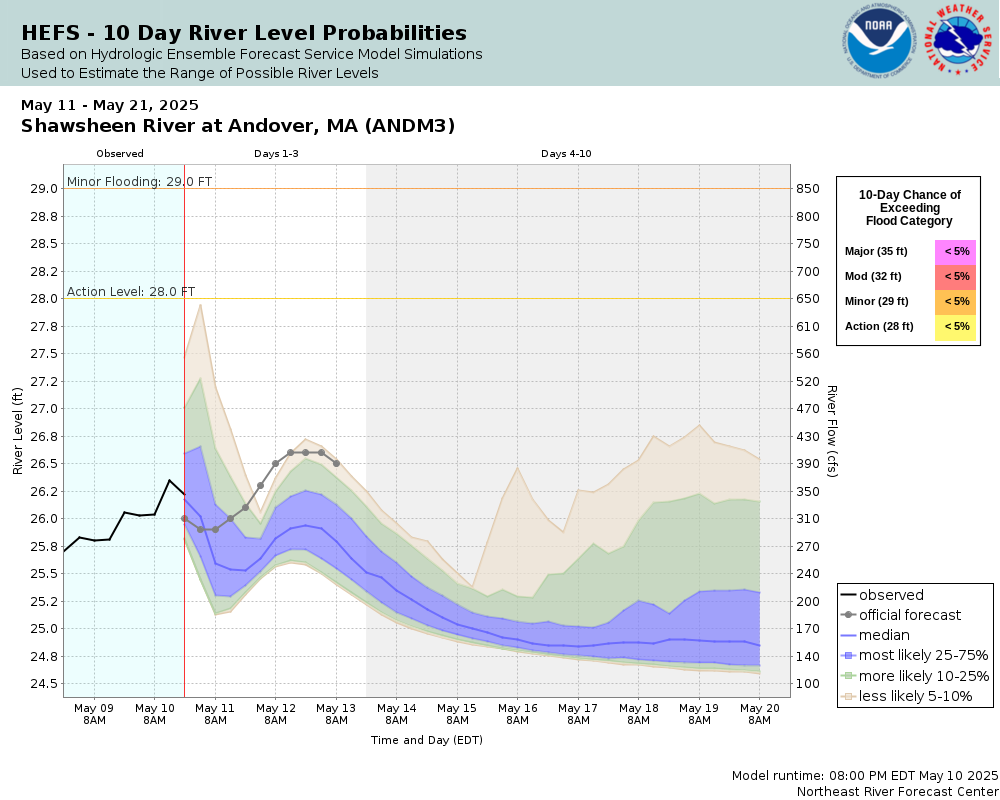
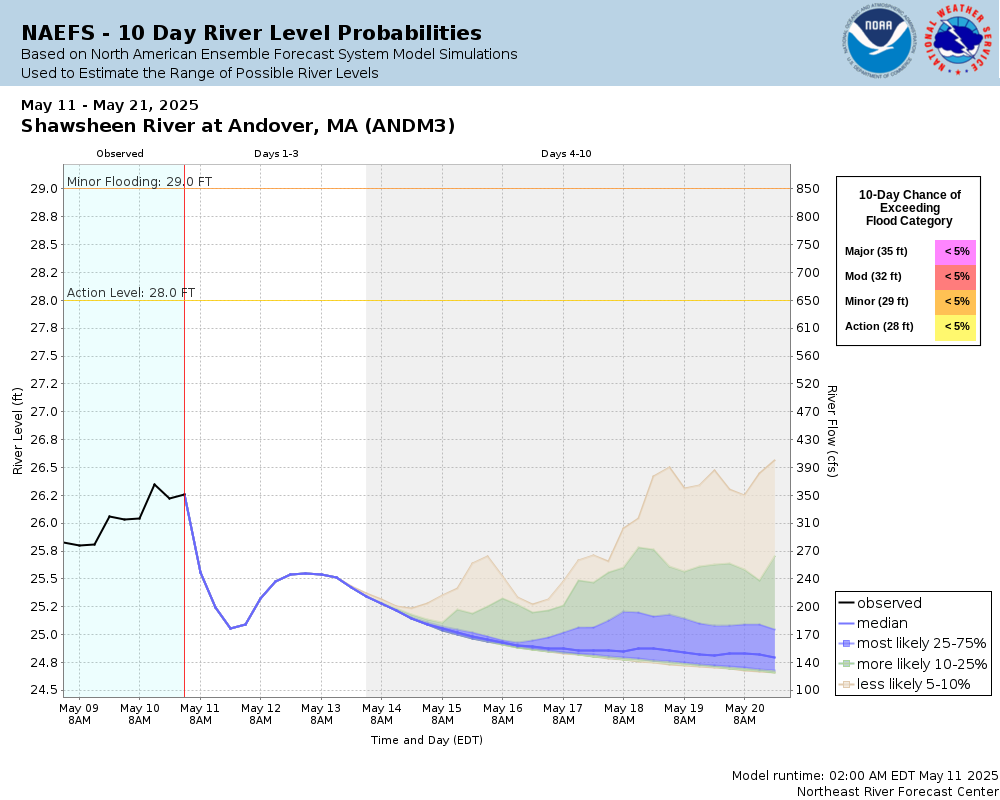
Potential River Levels Used to Estimate the Chance of Flooding and the Range of Possible River Levels |
||
| 10 Day (HEFS) | 10 Day (NAEFS) | 10 Day (GEFS) |
 |
 |
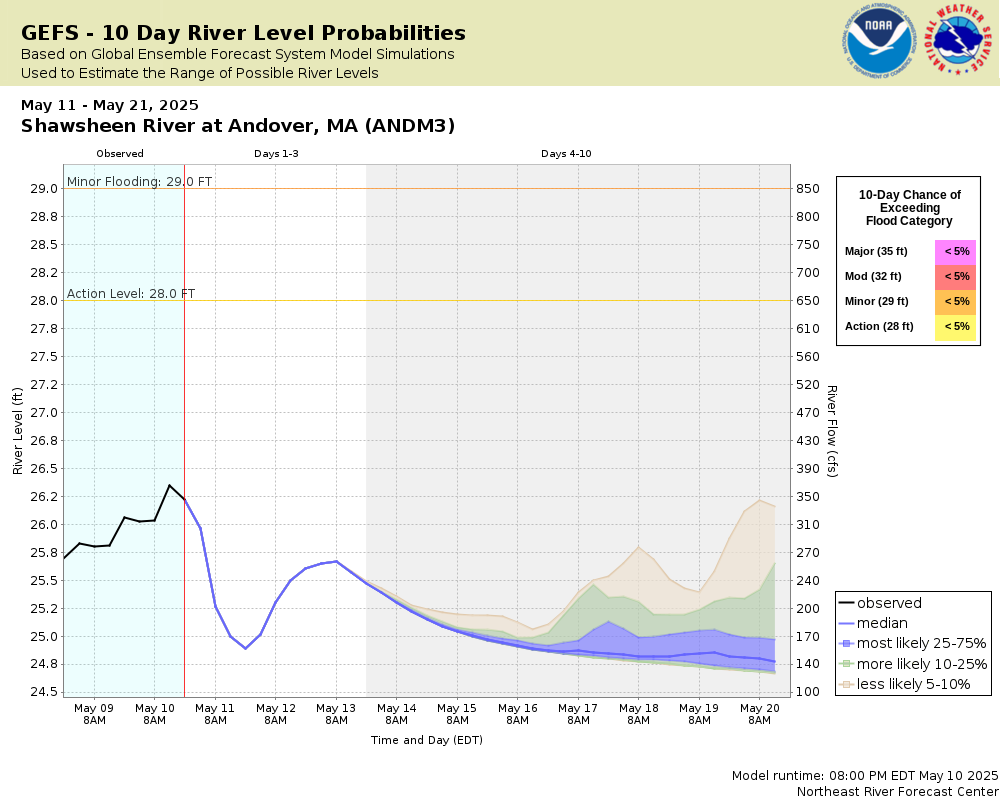 |
Note: Use the official hydrograph at the top of this web page for river levels within the next 72 Hours.
Click individual graphics to enlarge.
Collaborative Agencies
The National Weather Service prepares its forecasts and other services in collaboration with agencies like the US Geological Survey, US Bureau of Reclamation, US Army Corps of Engineers, Natural Resource Conservation Service, National Park Service, ALERT Users Group, Bureau of Indian Affairs, and many state and local emergency managers across the country. For details, please click here.