Chattahoochee River at 14th Street at Columbus
Future / Actual / Minor
OWP 2.0 WWA Modal Title
01/11/2021, 10:04 PM UTC through 01/11/2021, 10:04 PM UTC
Sender
Sent
- Downstream gauge unavailableWarning: no valid ratings curve available. Transformations to and from FEET/CFS/KCFS will not happen.
Traces and Thresholds Click to turn on/off display
Observed (OBS) 06/19/2025 10:45 PM EDTRecord: 55.2 ftCATEGORY STAGE 
Major Flooding 47 ft Moderate Flooding 42 ft Minor Flooding 27 ft Action 25 ft Reliability of the Forecast:
NOTE: Forecasts are issued as needed during times of high water, but are not routinely available.
Flood stage level has recently changed.
Automated gauge readings are now available, courtesy of the USGS.
National Water Model Hydrograph
Official NWS streamflow forecasts are produced by NWS hydrologic forecasters for river gauge locations using hydrologic models which are calibrated to that location. This process considers additional guidance and information, including local expertise and experience, to produce the best forecast possible. The NWM output provides supplemental guidance to NWS forecasters and should not be considered an official NWS river forecast.
Flood Impacts
- 55 - Record flooding occurs with a catastrophic and massive flood affecting Columbus and Phenix City. Most bridges will be closed with extensive damage to homes and businesses. The Weracoba and Bull Creeks will back up and cause additional damage to homes and businesses in Columbus. Portions of the Colonial Park area of south Columbus will be flooded 8 feet deep and will likely affect the water treatment plant. The USGS gage house at 14th Street will be under 6 feet of water with loss of data transmission.
- 52 - Widespread inundation flooding expands further into Columbus and Phenix City causing extensive damage to many homes and businesses. Most bridges will be closed. The Weracoba and Bull Creeks will back up and cause additional damage to homes and businesses in Columbus. Portions of the Colonial Park area of south Columbus will be flooded 5 feet deep and will likely affect the water treatment plant. The USGS gage house at the 14th Street bridge will be under 3 feet of water with a loss of data transmission.
- 49 - Widespread inundation flooding expands along the river upstream and downstream from Columbus and Phenix City causing damage to many homes and businesses. The Weracoba and Bull Creeks will back up in low lying areas and cause extensive damage to homes and businesses in Columbus. Portions of the Colonial Park area of south Columbus will be flooded two feet deep. Flood waters reach the top of USGS gage house at the 14th Street bridge with a loss of data transmission.
Gauge Info
| Coordinates | 32.4728, -84.9967 |
| RFC | SERFC |
| State | GA |
| WFO | FFC |
| County | Muscogee |
| Data Provider(s) | |
| US Geological Survey | USGS--Water Resources of the United States |
| USGS | 02341460 |
Gauge Location
Recent Crests
| 1. | 27.16 ft | on 05-28-2025 |
| 2. | 28.75 ft | on 04-08-2025 |
| 3. | 30.34 ft | on 02-16-2025 |
| 4. | 27.41 ft | on 09-30-2024 |
| 5. | 30.74 ft | on 09-28-2024 |
Recent Crests
| 1. | 27.16 ft | on 05-28-2025 |
| 2. | 28.75 ft | on 04-08-2025 |
| 3. | 30.34 ft | on 02-16-2025 |
| 4. | 27.41 ft | on 09-30-2024 |
| 5. | 30.74 ft | on 09-28-2024 |
| 6. | 30.77 ft | on 03-09-2024 |
| 7. | 35.47 ft | on 02-12-2024 |
| 8. | 29.64 ft | on 01-09-2024 |
| 9. | 34.23 ft | on 03-28-2023 |
| 10. | 28.97 ft | on 04-07-2022 |
| 11. | 31.68 ft | on 02-04-2022 |
| 12. | 28.64 ft | on 10-05-2021 |
| 13. | 28.64 ft | on 05-06-2021 |
| 14. | 32.41 ft | on 04-20-2020 |
| 15. | 30.27 ft | on 03-06-2020 |
| 16. | 27.02 ft | on 02-23-2020 |
| 17. | 29.22 ft | on 02-20-2020 |
| 18. | 27.09 ft | on 02-08-2020 |
| 19. | 27.16 ft | on 02-06-2020 |
| 20. | 28.20 ft | on 01-16-2020 |
| 21. | 28.37 ft | on 01-15-2020 |
| 22. | 33.12 ft | on 04-19-2019 |
| 23. | 27.96 ft | on 01-25-2019 |
| 24. | 29.79 ft | on 01-04-2019 |
| 25. | 27.22 ft | on 01-03-2019 |
| 26. | 27.99 ft | on 01-02-2019 |
| 27. | 28.93 ft | on 12-29-2018 |
| 28. | 28.82 ft | on 11-15-2018 |
| 29. | 31.38 ft | on 04-01-2016 |
| 30. | 26.47 ft | on 02-04-2016 |
| 31. | 35.84 ft | on 12-25-2015 |
| 32. | 24.90 ft | on 04-08-2014 |
| 33. | 21.02 ft | on 02-23-2013 |
| 34. | 20.96 ft | on 02-13-2013 |
| 35. | 26.07 ft | on 03-12-2010 |
| 36. | 23.52 ft | on 01-25-2010 |
| 37. | 24.02 ft | on 12-19-2009 |
| 38. | 23.29 ft | on 12-03-2009 |
| 39. | 23.54 ft | on 11-13-2009 |
| 40. | 28.81 ft | on 11-12-2009 |
| 41. | 23.54 ft | on 11-10-2009 |
| 42. | 21.72 ft | on 09-27-2009 |
| 43. | 27.72 ft | on 09-25-2009 |
| 44. | 20.35 ft | on 03-30-2009 |
| 45. | 23.02 ft | on 03-29-2009 |
| 46. | 39.95 ft | on 05-09-2003 |
| 47. | 34.01 ft | on 03-10-1998 |
| 48. | 31.24 ft | on 07-07-1994 |
| 49. | 32.89 ft | on 11-25-1992 |
| 50. | 41.14 ft | on 03-17-1990 |
| 51. | 26.94 ft | on 04-09-1983 |
| 52. | 26.23 ft | on 02-04-1982 |
| 53. | 30.71 ft | on 04-01-1981 |
| 54. | 27.37 ft | on 03-09-1980 |
| 55. | 30.91 ft | on 04-14-1979 |
| 56. | 31.60 ft | on 01-26-1978 |
| 57. | 26.07 ft | on 03-31-1977 |
| 58. | 33.90 ft | on 04-03-1975 |
| 59. | 26.67 ft | on 12-22-1972 |
| 60. | 30.70 ft | on 01-12-1972 |
| 61. | 38.50 ft | on 03-03-1971 |
| 62. | 34.44 ft | on 03-22-1970 |
| 63. | 29.69 ft | on 04-19-1969 |
| 64. | 25.91 ft | on 03-13-1968 |
| 65. | 30.72 ft | on 03-04-1966 |
| 66. | 32.40 ft | on 02-14-1966 |
| 67. | 26.70 ft | on 01-25-1965 |
| 68. | 25.25 ft | on 12-27-1964 |
| 69. | 25.30 ft | on 05-03-1964 |
| 70. | 33.72 ft | on 04-27-1964 |
| 71. | 45.89 ft | on 04-08-1964 |
| 72. | 28.05 ft | on 03-16-1964 |
| 73. | 25.68 ft | on 01-21-1963 |
| 74. | 25.06 ft | on 11-23-1962 |
| 75. | 27.30 ft | on 04-13-1962 |
| 76. | 25.01 ft | on 03-12-1962 |
| 77. | 32.02 ft | on 12-14-1961 |
| 78. | 32.30 ft | on 04-01-1961 |
| 79. | 49.80 ft | on 02-26-1961 |
| 80. | 30.80 ft | on 02-20-1961 |
| 81. | 31.90 ft | on 04-05-1960 |
| 82. | 27.00 ft | on 03-31-1960 |
| 83. | 25.90 ft | on 06-02-1959 |
| 84. | 25.90 ft | on 02-07-1958 |
| 85. | 36.00 ft | on 04-06-1957 |
| 86. | 30.00 ft | on 02-17-1956 |
| 87. | 25.20 ft | on 12-04-1953 |
| 88. | 27.10 ft | on 05-02-1953 |
| 89. | 28.80 ft | on 03-25-1952 |
| 90. | 32.20 ft | on 03-05-1952 |
| 91. | 44.40 ft | on 11-28-1949 |
| 92. | 33.80 ft | on 04-30-1949 |
| 93. | 38.60 ft | on 07-11-1948 |
| 94. | 25.00 ft | on 02-10-1948 |
| 95. | 30.90 ft | on 01-21-1947 |
| 96. | 28.00 ft | on 03-29-1946 |
| 97. | 28.10 ft | on 01-12-1946 |
| 98. | 33.50 ft | on 01-07-1946 |
| 99. | 35.20 ft | on 04-26-1945 |
| 100. | 34.70 ft | on 04-27-1944 |
| 101. | 31.60 ft | on 03-30-1944 |
| 102. | 36.10 ft | on 03-23-1944 |
| 103. | 43.00 ft | on 03-21-1943 |
| 104. | 29.14 ft | on 01-19-1943 |
| 105. | 38.90 ft | on 03-22-1942 |
| 106. | 25.50 ft | on 02-10-1940 |
| 107. | 32.15 ft | on 03-30-1939 |
| 108. | 31.30 ft | on 03-01-1939 |
| 109. | 39.60 ft | on 04-09-1938 |
| 110. | 31.22 ft | on 04-01-1938 |
| 111. | 27.00 ft | on 03-20-1937 |
| 112. | 32.50 ft | on 01-06-1937 |
| 113. | 40.24 ft | on 04-09-1936 |
| 114. | 35.52 ft | on 02-05-1936 |
| 115. | 30.10 ft | on 01-20-1936 |
| 116. | 29.76 ft | on 01-09-1936 |
| 117. | 32.99 ft | on 01-01-1936 |
| 118. | 29.62 ft | on 03-05-1934 |
| 119. | 26.90 ft | on 03-21-1933 |
| 120. | 26.08 ft | on 02-21-1933 |
| 121. | 33.12 ft | on 12-30-1932 |
| 122. | 28.63 ft | on 11-17-1930 |
| 123. | 26.10 ft | on 10-01-1929 |
| 124. | 55.20 ft | on 03-15-1929 |
| 125. | 48.00 ft | on 01-19-1925 |
| 126. | 52.60 ft | on 12-12-1919 |
| 127. | 27.97 ft | on 05-01-1917 |
| 128. | 42.00 ft | on 03-15-1913 |
Historic Crests
| 1. | 55.20 ft | on 03-15-1929 |
| 2. | 52.60 ft | on 12-12-1919 |
| 3. | 49.80 ft | on 02-26-1961 |
| 4. | 48.00 ft | on 01-19-1925 |
| 5. | 45.89 ft | on 04-08-1964 |
Historic Crests
| 1. | 55.20 ft | on 03-15-1929 |
| 2. | 52.60 ft | on 12-12-1919 |
| 3. | 49.80 ft | on 02-26-1961 |
| 4. | 48.00 ft | on 01-19-1925 |
| 5. | 45.89 ft | on 04-08-1964 |
| 6. | 44.40 ft | on 11-28-1949 |
| 7. | 43.00 ft | on 03-21-1943 |
| 8. | 42.00 ft | on 03-15-1913 |
| 9. | 41.14 ft | on 03-17-1990 |
| 10. | 40.24 ft | on 04-09-1936 |
| 11. | 39.95 ft | on 05-09-2003 |
| 12. | 39.60 ft | on 04-09-1938 |
| 13. | 38.90 ft | on 03-22-1942 |
| 14. | 38.60 ft | on 07-11-1948 |
| 15. | 38.50 ft | on 03-03-1971 |
| 16. | 36.10 ft | on 03-23-1944 |
| 17. | 36.00 ft | on 04-06-1957 |
| 18. | 35.84 ft | on 12-25-2015 |
| 19. | 35.52 ft | on 02-05-1936 |
| 20. | 35.47 ft | on 02-12-2024 |
| 21. | 35.20 ft | on 04-26-1945 |
| 22. | 34.70 ft | on 04-27-1944 |
| 23. | 34.44 ft | on 03-22-1970 |
| 24. | 34.23 ft | on 03-28-2023 |
| 25. | 34.01 ft | on 03-10-1998 |
| 26. | 33.90 ft | on 04-03-1975 |
| 27. | 33.80 ft | on 04-30-1949 |
| 28. | 33.72 ft | on 04-27-1964 |
| 29. | 33.50 ft | on 01-07-1946 |
| 30. | 33.12 ft | on 04-19-2019 |
| 31. | 33.12 ft | on 12-30-1932 |
| 32. | 32.99 ft | on 01-01-1936 |
| 33. | 32.89 ft | on 11-25-1992 |
| 34. | 32.50 ft | on 01-06-1937 |
| 35. | 32.41 ft | on 04-20-2020 |
| 36. | 32.40 ft | on 02-14-1966 |
| 37. | 32.30 ft | on 04-01-1961 |
| 38. | 32.20 ft | on 03-05-1952 |
| 39. | 32.15 ft | on 03-30-1939 |
| 40. | 32.02 ft | on 12-14-1961 |
| 41. | 31.90 ft | on 04-05-1960 |
| 42. | 31.68 ft | on 02-04-2022 |
| 43. | 31.60 ft | on 03-30-1944 |
| 44. | 31.60 ft | on 01-26-1978 |
| 45. | 31.38 ft | on 04-01-2016 |
| 46. | 31.30 ft | on 03-01-1939 |
| 47. | 31.24 ft | on 07-07-1994 |
| 48. | 31.22 ft | on 04-01-1938 |
| 49. | 30.91 ft | on 04-14-1979 |
| 50. | 30.90 ft | on 01-21-1947 |
| 51. | 30.80 ft | on 02-20-1961 |
| 52. | 30.77 ft | on 03-09-2024 |
| 53. | 30.74 ft | on 09-28-2024 |
| 54. | 30.72 ft | on 03-04-1966 |
| 55. | 30.71 ft | on 04-01-1981 |
| 56. | 30.70 ft | on 01-12-1972 |
| 57. | 30.34 ft | on 02-16-2025 |
| 58. | 30.27 ft | on 03-06-2020 |
| 59. | 30.10 ft | on 01-20-1936 |
| 60. | 30.00 ft | on 02-17-1956 |
| 61. | 29.79 ft | on 01-04-2019 |
| 62. | 29.76 ft | on 01-09-1936 |
| 63. | 29.69 ft | on 04-19-1969 |
| 64. | 29.64 ft | on 01-09-2024 |
| 65. | 29.62 ft | on 03-05-1934 |
| 66. | 29.22 ft | on 02-20-2020 |
| 67. | 29.14 ft | on 01-19-1943 |
| 68. | 28.97 ft | on 04-07-2022 |
| 69. | 28.93 ft | on 12-29-2018 |
| 70. | 28.82 ft | on 11-15-2018 |
| 71. | 28.81 ft | on 11-12-2009 |
| 72. | 28.80 ft | on 03-25-1952 |
| 73. | 28.75 ft | on 04-08-2025 |
| 74. | 28.64 ft | on 05-06-2021 |
| 75. | 28.64 ft | on 10-05-2021 |
| 76. | 28.63 ft | on 11-17-1930 |
| 77. | 28.37 ft | on 01-15-2020 |
| 78. | 28.20 ft | on 01-16-2020 |
| 79. | 28.10 ft | on 01-12-1946 |
| 80. | 28.05 ft | on 03-16-1964 |
| 81. | 28.00 ft | on 03-29-1946 |
| 82. | 27.99 ft | on 01-02-2019 |
| 83. | 27.97 ft | on 05-01-1917 |
| 84. | 27.96 ft | on 01-25-2019 |
| 85. | 27.72 ft | on 09-25-2009 |
| 86. | 27.41 ft | on 09-30-2024 |
| 87. | 27.37 ft | on 03-09-1980 |
| 88. | 27.30 ft | on 04-13-1962 |
| 89. | 27.22 ft | on 01-03-2019 |
| 90. | 27.16 ft | on 05-28-2025 |
| 91. | 27.16 ft | on 02-06-2020 |
| 92. | 27.10 ft | on 05-02-1953 |
| 93. | 27.09 ft | on 02-08-2020 |
| 94. | 27.02 ft | on 02-23-2020 |
| 95. | 27.00 ft | on 03-20-1937 |
| 96. | 27.00 ft | on 03-31-1960 |
| 97. | 26.94 ft | on 04-09-1983 |
| 98. | 26.90 ft | on 03-21-1933 |
| 99. | 26.70 ft | on 01-25-1965 |
| 100. | 26.67 ft | on 12-22-1972 |
| 101. | 26.47 ft | on 02-04-2016 |
| 102. | 26.23 ft | on 02-04-1982 |
| 103. | 26.10 ft | on 10-01-1929 |
| 104. | 26.08 ft | on 02-21-1933 |
| 105. | 26.07 ft | on 03-31-1977 |
| 106. | 26.07 ft | on 03-12-2010 |
| 107. | 25.91 ft | on 03-13-1968 |
| 108. | 25.90 ft | on 02-07-1958 |
| 109. | 25.90 ft | on 06-02-1959 |
| 110. | 25.68 ft | on 01-21-1963 |
| 111. | 25.50 ft | on 02-10-1940 |
| 112. | 25.30 ft | on 05-03-1964 |
| 113. | 25.25 ft | on 12-27-1964 |
| 114. | 25.20 ft | on 12-04-1953 |
| 115. | 25.06 ft | on 11-23-1962 |
| 116. | 25.01 ft | on 03-12-1962 |
| 117. | 25.00 ft | on 02-10-1948 |
| 118. | 24.90 ft | on 04-08-2014 |
| 119. | 24.02 ft | on 12-19-2009 |
| 120. | 23.54 ft | on 11-10-2009 |
| 121. | 23.54 ft | on 11-13-2009 |
| 122. | 23.52 ft | on 01-25-2010 |
| 123. | 23.29 ft | on 12-03-2009 |
| 124. | 23.02 ft | on 03-29-2009 |
| 125. | 21.72 ft | on 09-27-2009 |
| 126. | 21.02 ft | on 02-23-2013 |
| 127. | 20.96 ft | on 02-13-2013 |
| 128. | 20.35 ft | on 03-30-2009 |
Low Water Records
Low Water Records
Vertical Datum Table
| type | NAVD88 | STND |
|---|---|---|
| major Flooding | 237.00 ft | 47.00 ft |
| moderate Flooding | 232.00 ft | 42.00 ft |
| minor Flooding | 217.00 ft | 27.00 ft |
| action | 215.00 ft | 25.00 ft |
| Latest Value | 210.75 ft | 20.75 ft |
| Gauge Zero | 190.00 ft | 0.00 ft |
Gauge Photos
No Images Found


Unique Local Info
|
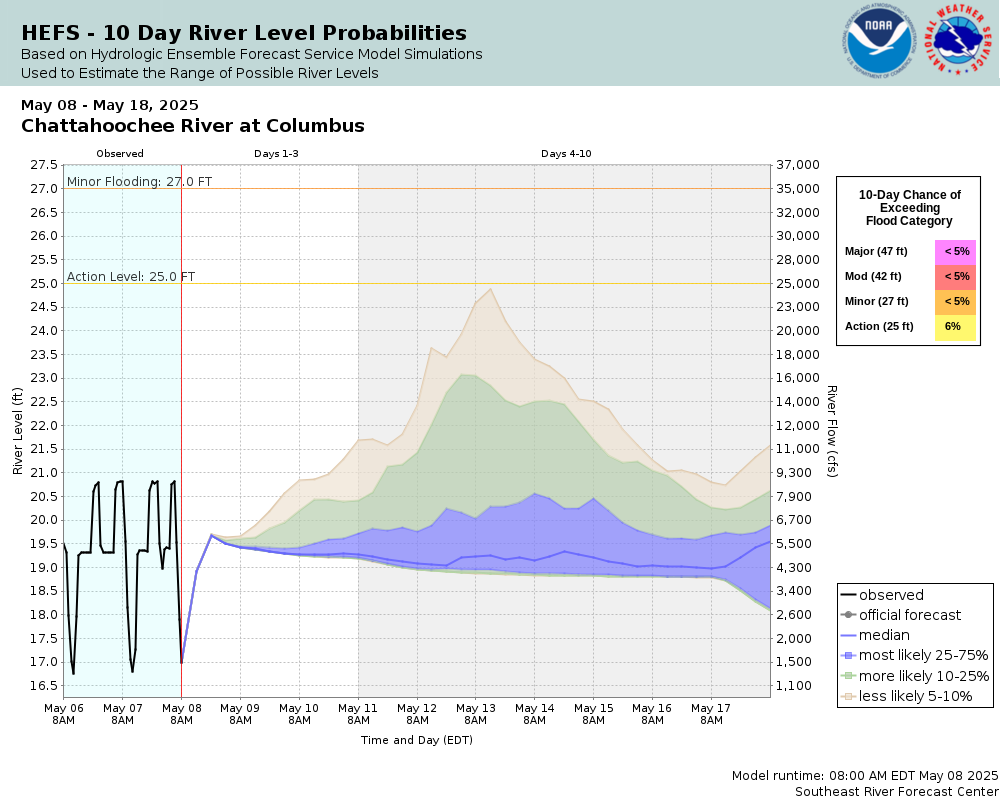
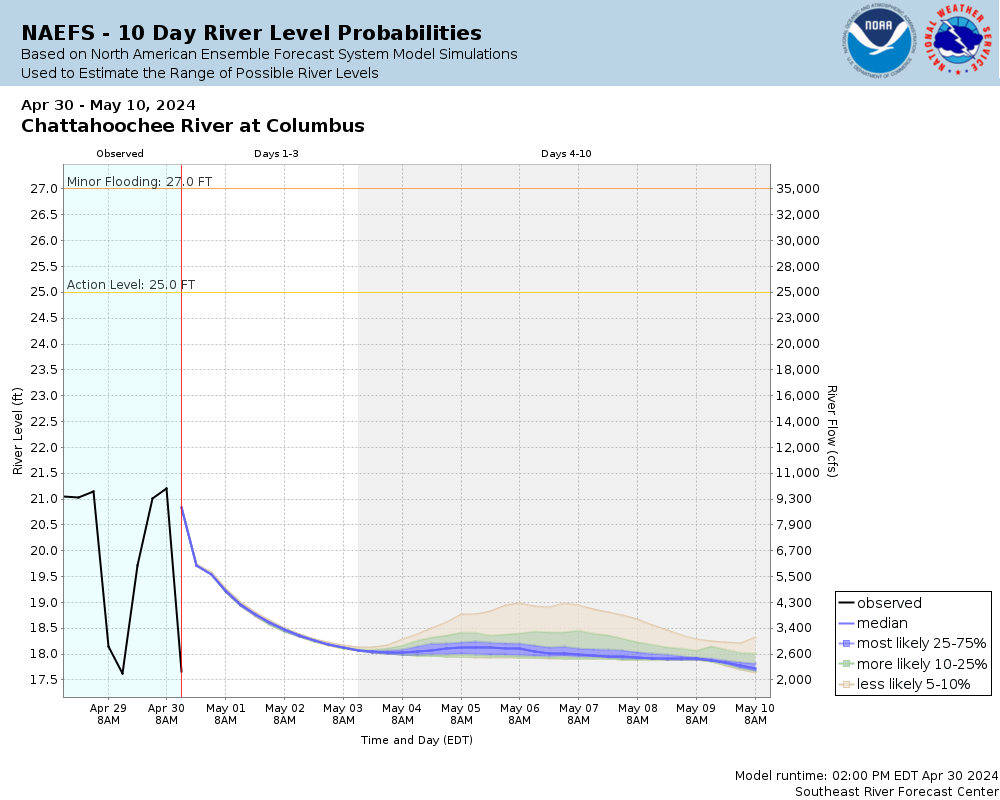
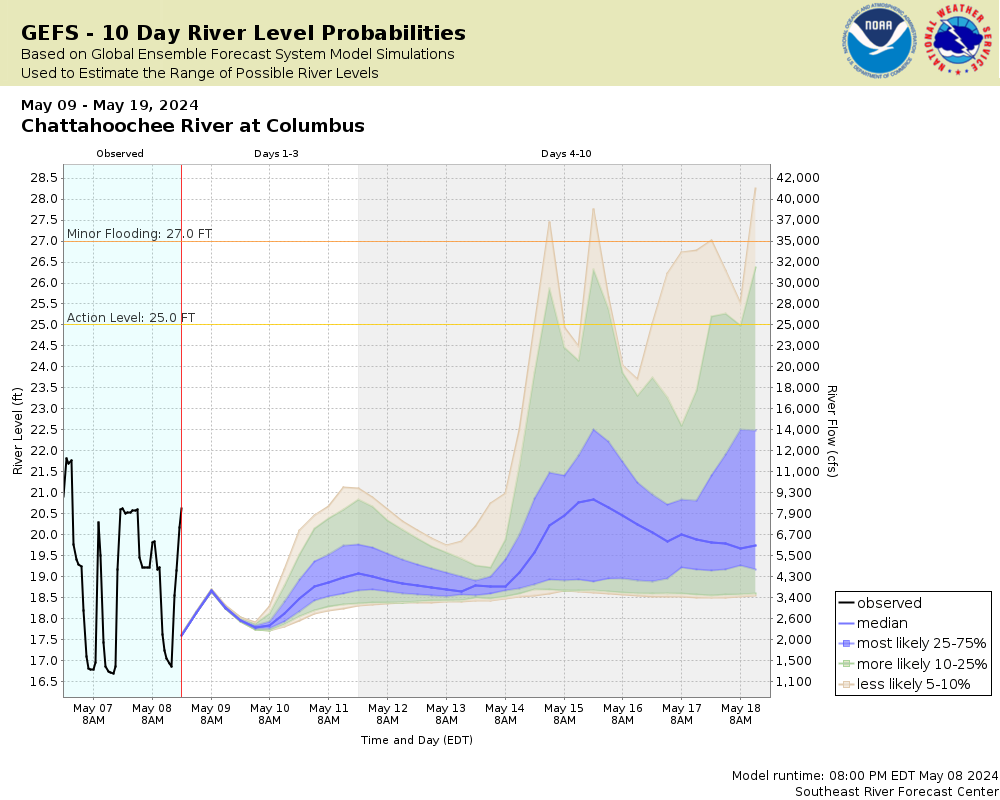
Potential River Levels Used to Estimate the Chance of Flooding and the Range of Possible River Levels |
||
| 10 Day (HEFS) | 7 Day (NAEFS) | 7 Day (GEFS) |
 |
 |
 |
Note: Use the official hydrograph at the top of this web page for river levels within the next 72 Hours.
Collaborative Agencies
The National Weather Service prepares its forecasts and other services in collaboration with agencies like the US Geological Survey, US Bureau of Reclamation, US Army Corps of Engineers, Natural Resource Conservation Service, National Park Service, ALERT Users Group, Bureau of Indian Affairs, and many state and local emergency managers across the country. For details, please click here.