Delaware River at Callicoon
Future / Actual / Minor
OWP 2.0 WWA Modal Title
01/11/2021, 10:04 PM UTC through 01/11/2021, 10:04 PM UTC
Sender
Sent
- Warning: no valid ratings curve available. Transformations to and from FEET/CFS/KCFS will not happen.
Traces and Thresholds Click to turn on/off display
Observed (OBS) 06/24/2025 11:30 AM EDTOfficial Forecast (FCST) 06/24/2025 9:30 AM EDTRecord: 20.4 ftCATEGORY STAGE 
Major Flooding 14.8 ft Moderate Flooding 13 ft Minor Flooding 12 ft Action 9 ft Reliability of the Forecast:
NOTE: Forecasts are issued routinely year-round.
National Water Model Hydrograph
Official NWS streamflow forecasts are produced by NWS hydrologic forecasters for river gauge locations using hydrologic models which are calibrated to that location. This process considers additional guidance and information, including local expertise and experience, to produce the best forecast possible. The NWM output provides supplemental guidance to NWS forecasters and should not be considered an official NWS river forecast.
Flood Impacts
- 20.38 - Widespread flooding occurrs along portions of Main Street and River Road in the Hamlet of Callicoon along with surrounding rural areas near the Delaware River. Backwater flooding from Callicoon Creek is extensive and will increase flood damages along Main Street. This level is the record flood of June 2006.
- 16.5 - Flooding affects homes and businesses along River Road and Main Street in Callicoon, especially north of the bridge. Flooding develops in the parking lot of Peck's grocery. Dorrer Drive becomes flooded above this level. Backwater from Callicoon Creek may increase flood damages. Flooding is extensive in areas of Damascus Township.
- 14.8 - Backwater flooding from the Delaware river up Callicoon Creek may affect the ballpark on Creamery Road. Flooding worsens on the Pennsylvania side of the river. This was the approximate level of the ice jam flood of January 1979.
Gauge Info
| Coordinates | 41.7567, -75.0578 |
| RFC | MARFC |
| State | NY |
| WFO | BGM |
| County | Sullivan |
| Data Provider(s) | |
| US Geological Survey | USGS--Water Resources of the United States |
| USGS | 01427510 |
Gauge Location
Recent Crests
| 1. | 13.68 ft | on 10-27-2021 |
| 2. | 12.71 ft | on 12-25-2020 |
| 3. | 14.34 ft | on 09-08-2011 |
| 4. | 12.87 ft | on 09-07-2011 |
| 5. | 12.90 ft | on 08-29-2011 |
Recent Crests
| 1. | 13.68 ft | on 10-27-2021 |
| 2. | 12.71 ft | on 12-25-2020 |
| 3. | 14.34 ft | on 09-08-2011 |
| 4. | 12.87 ft | on 09-07-2011 |
| 5. | 12.90 ft | on 08-29-2011 |
| 6. | 13.10 ft | on 10-01-2010 |
| 7. | 20.38 ft | on 06-28-2006 |
| 8. | 17.98 ft | on 04-03-2005 |
| 9. | 17.33 ft | on 09-18-2004 |
| 10. | 12.03 ft | on 12-02-1996 |
| 11. | 16.31 ft | on 01-19-1996 |
| 12. | 13.42 ft | on 03-15-1986 |
| 13. | 13.19 ft | on 02-12-1981 |
| 14. | 14.83 ft | on 01-09-1979 |
Historic Crests
| 1. | 20.38 ft | on 06-28-2006 |
| 2. | 17.98 ft | on 04-03-2005 |
| 3. | 17.33 ft | on 09-18-2004 |
| 4. | 16.31 ft | on 01-19-1996 |
| 5. | 14.83 ft | on 01-09-1979 |
Historic Crests
| 1. | 20.38 ft | on 06-28-2006 |
| 2. | 17.98 ft | on 04-03-2005 |
| 3. | 17.33 ft | on 09-18-2004 |
| 4. | 16.31 ft | on 01-19-1996 |
| 5. | 14.83 ft | on 01-09-1979 |
| 6. | 14.34 ft | on 09-08-2011 |
| 7. | 13.68 ft | on 10-27-2021 |
| 8. | 13.42 ft | on 03-15-1986 |
| 9. | 13.19 ft | on 02-12-1981 |
| 10. | 13.10 ft | on 10-01-2010 |
| 11. | 12.90 ft | on 08-29-2011 |
| 12. | 12.87 ft | on 09-07-2011 |
| 13. | 12.71 ft | on 12-25-2020 |
| 14. | 12.03 ft | on 12-02-1996 |
Vertical Datum Table
| type | NAVD88 |
|---|---|
| major Flooding | 749.13 ft |
| moderate Flooding | 747.33 ft |
| minor Flooding | 746.33 ft |
| action | 743.33 ft |
| Latest Value | 739.32 ft |
| Gauge Zero | 734.33 ft |
Gauge Photos
No Images Found


Unique Local Info
|
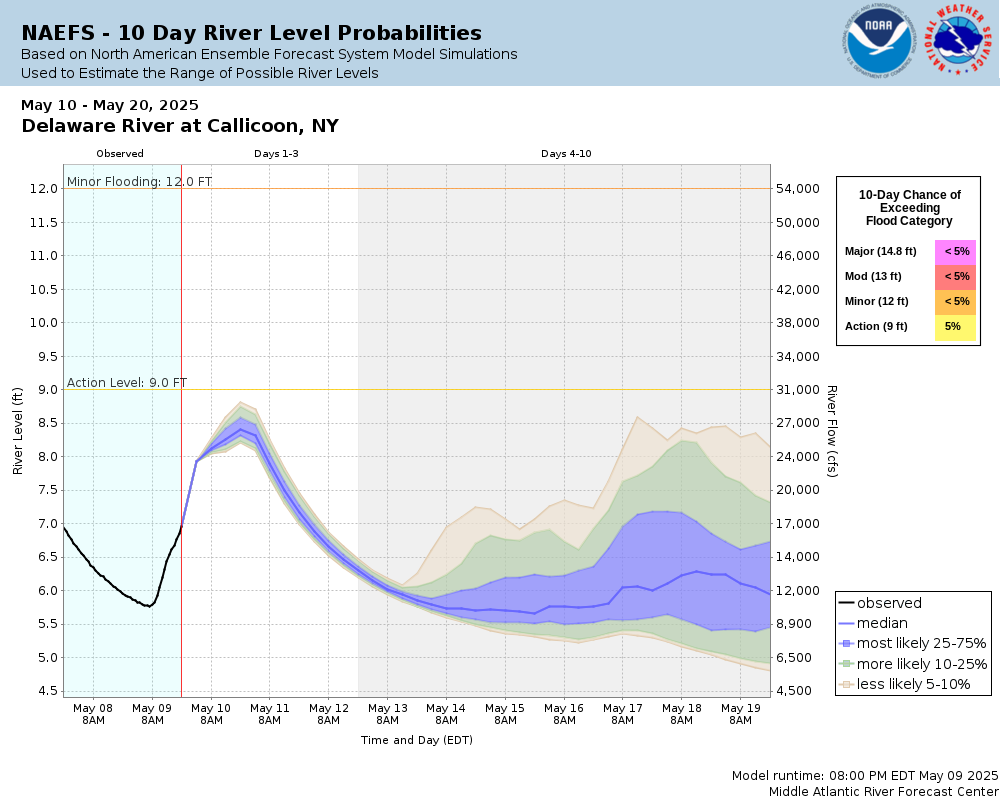
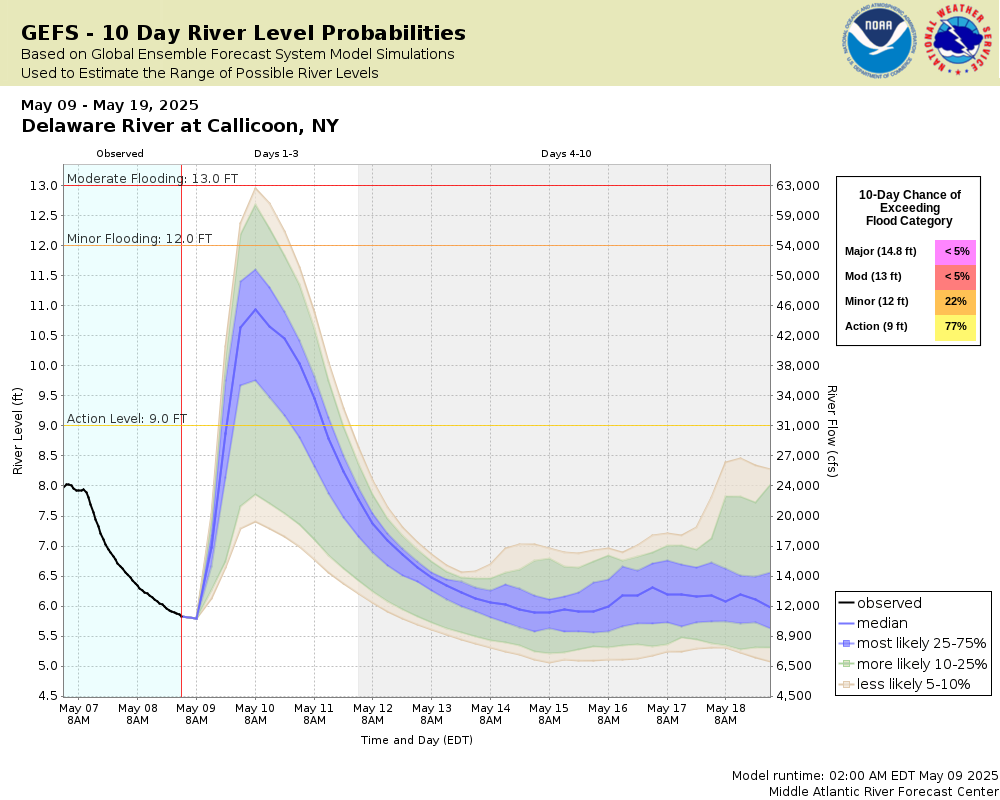
Potential River Levels Used to Estimate the Chance of Flooding and the Range of Possible River Levels |
||
| 10 Day (HEFS) | 10 Day (NAEFS) | 10 Day (GEFS) |
 |
 |
 |
Note: Use the official hydrograph at the top of this web page for river levels within the next 72 Hours.
Click individual graphics to enlarge.
Collaborative Agencies
The National Weather Service prepares its forecasts and other services in collaboration with agencies like the US Geological Survey, US Bureau of Reclamation, US Army Corps of Engineers, Natural Resource Conservation Service, National Park Service, ALERT Users Group, Bureau of Indian Affairs, and many state and local emergency managers across the country. For details, please click here.