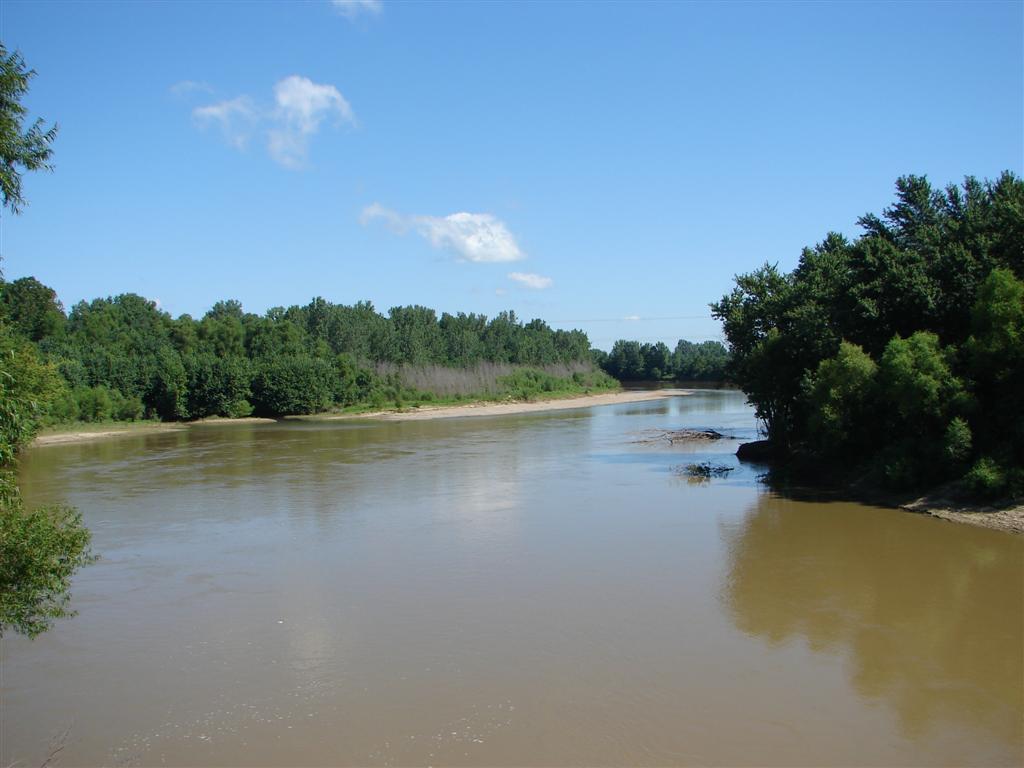
White River (IN) near Edwardsport
Future / Actual / Minor
OWP 2.0 WWA Modal Title
01/11/2021, 10:04 PM UTC through 01/11/2021, 10:04 PM UTC
Sender
Sent
- Warning: no valid ratings curve available. Transformations to and from FEET/CFS/KCFS will not happen.
Traces and Thresholds Click to turn on/off display
Observed (OBS) 04/01/2025 5:30 AM EDTOfficial Forecast (FCST) 03/31/2025 10:32 AM EDTRecord: 29.2 ftCATEGORY STAGE 
Major Flooding 25 ft Moderate Flooding 22 ft Minor Flooding 15 ft Action 12 ft Reliability of the Forecast:
NOTE: Forecasts are issued as needed during times of high water, but are not routinely available.
National Water Model Hydrograph
Official NWS streamflow forecasts are produced by NWS hydrologic forecasters for river gauge locations using hydrologic models which are calibrated to that location. This process considers additional guidance and information, including local expertise and experience, to produce the best forecast possible. The NWM output provides supplemental guidance to NWS forecasters and should not be considered an official NWS river forecast.
Flood Impacts
- 30 - Water reaches height of a flood approximating the March 1913 flood flow under current levee conditions. Much of Daviess and Knox counties is underwater.
- 29.24 - Record flood in progress. Flood levels not seen since June 2008. Crest of June 2008 flood at this site as determined by the closest Indiana DNR high water mark to SR 358 bridge. This was 0.15 feet shy of crest according to staff gage at old Edwardsport Power Plant. Other nearby high water marks ranged from almost spot on to slightly more than a foot lower.
- 29 - Water reaches top of Levee Unit 8 (locally known as the Bennington Levee) protecting thousands of acres of farmland and the town of Plainville. Record flood elevation is in progress. Breaking of levees would cause a major flood. Highway and railroad bridges are in danger of washing away.
Gauge Info
| Coordinates | 38.7951, -87.2419 |
| RFC | OHRFC |
| State | IN |
| WFO | IND |
| County | Knox |
| Data Provider(s) | |
| US Geological Survey | USGS--Water Resources of the United States |
| USGS | 03360730 |
Gauge Location
Recent Crests
| 1. | 22.19 ft | on 04-16-2024 | (P) |
| 2. | 18.76 ft | on 01-03-2022 | (P) |
| 3. | 16.58 ft | on 12-20-2021 | (P) |
| 4. | 15.88 ft | on 10-30-2021 | (P) |
| 5. | 18.46 ft | on 07-20-2021 | (P) |
Recent Crests
| 1. | 22.19 ft | on 04-16-2024 | (P) |
| 2. | 18.76 ft | on 01-03-2022 | (P) |
| 3. | 16.58 ft | on 12-20-2021 | (P) |
| 4. | 15.88 ft | on 10-30-2021 | (P) |
| 5. | 18.46 ft | on 07-20-2021 | (P) |
| 6. | 19.50 ft | on 03-23-2021 | (P) |
| 7. | 19.60 ft | on 03-03-2021 | (P) |
| 8. | 19.45 ft | on 05-22-2020 | (P) |
| 9. | 18.75 ft | on 04-03-2020 | (P) |
| 10. | 21.55 ft | on 03-22-2020 | (P) |
| 11. | 20.09 ft | on 02-15-2020 | (P) |
| 12. | 16.68 ft | on 01-02-2020 | (P) |
| 13. | 16.00 ft | on 12-02-2019 | (P) |
| 14. | 22.21 ft | on 06-22-2019 | |
| 15. | 17.17 ft | on 05-25-2019 | |
| 16. | 19.99 ft | on 04-30-2019 | |
| 17. | 18.49 ft | on 03-14-2019 | |
| 18. | 24.34 ft | on 02-12-2019 | |
| 19. | 17.41 ft | on 01-05-2019 | |
| 20. | 15.97 ft | on 12-17-2018 | |
| 21. | 17.37 ft | on 11-05-2018 | |
| 22. | 18.64 ft | on 09-13-2018 | |
| 23. | 13.17 ft | on 06-13-2018 | |
| 24. | 24.69 ft | on 04-08-2018 | |
| 25. | 22.50 ft | on 02-28-2018 | |
| 26. | 20.57 ft | on 07-17-2017 | (P) |
| 27. | 15.35 ft | on 06-28-2017 | (P) |
| 28. | 15.06 ft | on 05-30-2017 | (P) |
| 29. | 25.17 ft | on 05-09-2017 | |
| 30. | 19.93 ft | on 01-24-2017 | (P) |
| 31. | 17.84 ft | on 08-17-2016 | (P) |
| 32. | 15.37 ft | on 05-03-2016 | (P) |
| 33. | 18.95 ft | on 04-15-2016 | (P) |
| 34. | 15.12 ft | on 04-03-2016 | (P) |
| 35. | 17.36 ft | on 02-27-2016 | (P) |
| 36. | 22.32 ft | on 01-02-2016 | |
| 37. | 21.52 ft | on 07-19-2015 | |
| 38. | 19.90 ft | on 07-04-2015 | |
| 39. | 19.10 ft | on 06-21-2015 | |
| 40. | 19.78 ft | on 04-14-2015 | |
| 41. | 19.73 ft | on 03-16-2015 | |
| 42. | 17.40 ft | on 12-08-2014 | |
| 43. | 22.98 ft | on 04-08-2014 | |
| 44. | 23.34 ft | on 12-26-2013 | |
| 45. | 25.40 ft | on 04-24-2013 | |
| 46. | 23.73 ft | on 01-18-2013 | |
| 47. | 29.24 ft | on 06-10-2008 |
Historic Crests
| 1. | 29.24 ft | on 06-10-2008 |
| 2. | 25.40 ft | on 04-24-2013 |
| 3. | 25.17 ft | on 05-09-2017 |
| 4. | 24.69 ft | on 04-08-2018 |
| 5. | 24.34 ft | on 02-12-2019 |
Historic Crests
| 1. | 29.24 ft | on 06-10-2008 | |
| 2. | 25.40 ft | on 04-24-2013 | |
| 3. | 25.17 ft | on 05-09-2017 | |
| 4. | 24.69 ft | on 04-08-2018 | |
| 5. | 24.34 ft | on 02-12-2019 | |
| 6. | 23.73 ft | on 01-18-2013 | |
| 7. | 23.34 ft | on 12-26-2013 | |
| 8. | 22.98 ft | on 04-08-2014 | |
| 9. | 22.50 ft | on 02-28-2018 | |
| 10. | 22.32 ft | on 01-02-2016 | |
| 11. | 22.21 ft | on 06-22-2019 | |
| 12. | 22.19 ft | on 04-16-2024 | (P) |
| 13. | 21.55 ft | on 03-22-2020 | (P) |
| 14. | 21.52 ft | on 07-19-2015 | |
| 15. | 20.57 ft | on 07-17-2017 | (P) |
| 16. | 20.09 ft | on 02-15-2020 | (P) |
| 17. | 19.99 ft | on 04-30-2019 | |
| 18. | 19.93 ft | on 01-24-2017 | (P) |
| 19. | 19.90 ft | on 07-04-2015 | |
| 20. | 19.78 ft | on 04-14-2015 | |
| 21. | 19.73 ft | on 03-16-2015 | |
| 22. | 19.60 ft | on 03-03-2021 | (P) |
| 23. | 19.50 ft | on 03-23-2021 | (P) |
| 24. | 19.45 ft | on 05-22-2020 | (P) |
| 25. | 19.10 ft | on 06-21-2015 | |
| 26. | 18.95 ft | on 04-15-2016 | (P) |
| 27. | 18.76 ft | on 01-03-2022 | (P) |
| 28. | 18.75 ft | on 04-03-2020 | (P) |
| 29. | 18.64 ft | on 09-13-2018 | |
| 30. | 18.49 ft | on 03-14-2019 | |
| 31. | 18.46 ft | on 07-20-2021 | (P) |
| 32. | 17.84 ft | on 08-17-2016 | (P) |
| 33. | 17.41 ft | on 01-05-2019 | |
| 34. | 17.40 ft | on 12-08-2014 | |
| 35. | 17.37 ft | on 11-05-2018 | |
| 36. | 17.36 ft | on 02-27-2016 | (P) |
| 37. | 17.17 ft | on 05-25-2019 | |
| 38. | 16.68 ft | on 01-02-2020 | (P) |
| 39. | 16.58 ft | on 12-20-2021 | (P) |
| 40. | 16.00 ft | on 12-02-2019 | (P) |
| 41. | 15.97 ft | on 12-17-2018 | |
| 42. | 15.88 ft | on 10-30-2021 | (P) |
| 43. | 15.37 ft | on 05-03-2016 | (P) |
| 44. | 15.35 ft | on 06-28-2017 | (P) |
| 45. | 15.12 ft | on 04-03-2016 | (P) |
| 46. | 15.06 ft | on 05-30-2017 | (P) |
| 47. | 13.17 ft | on 06-13-2018 |
Vertical Datum Table
| type | NAVD88 |
|---|---|
| major Flooding | 456.56 ft |
| moderate Flooding | 453.56 ft |
| minor Flooding | 446.56 ft |
| action | 443.56 ft |
| Latest Value | 440.13 ft |
| Gauge Zero | 431.56 ft |


Probability Information
No Images Available
Unique Local Info
The river stage displayed on this hydrograph approximates the Edwardsport Staff Gage located at the Old Power Plant site during a moderate flood.
Collaborative Agencies
The National Weather Service prepares its forecasts and other services in collaboration with agencies like the US Geological Survey, US Bureau of Reclamation, US Army Corps of Engineers, Natural Resource Conservation Service, National Park Service, ALERT Users Group, Bureau of Indian Affairs, and many state and local emergency managers across the country. For details, please click here.
Resources
Hydrologic Resource Links
- River Forecast Centers
- Text Products
- Forecast Precipitation
- US Geological Survey Surface Water
- How to Use US Geological Survey Water Alert Feature
- Water Resources Outlook
- Wabash River Conservation Area
- Water flow from Norway and Oakdale Dams
- Indianapolis Reservoir Levels
- Midwest Region U.S. Drought Monitor
- Indianapolis Museum of Art: FLOW Can You See the River?
- The Flood of 1913 - Remembered
- Friends of the White River
Additional Resource Links
- NWS Precipitation and River Forecasting
- Area Hydrographs
- Zoomable RFC Hourly Precipitation Maps
- Zoomable Snowfall Maps
- Indiana State Climate Office
- Community Collaborative Rain, Hail & Snow Network in Indiana
- Snow Information
- Midwestern Regional Climate Center
- Indiana Precipitation Frequencies
- Drainage Areas of Indiana Streams
- Ensemble River Forecasts
- Ohio River Forecast Center