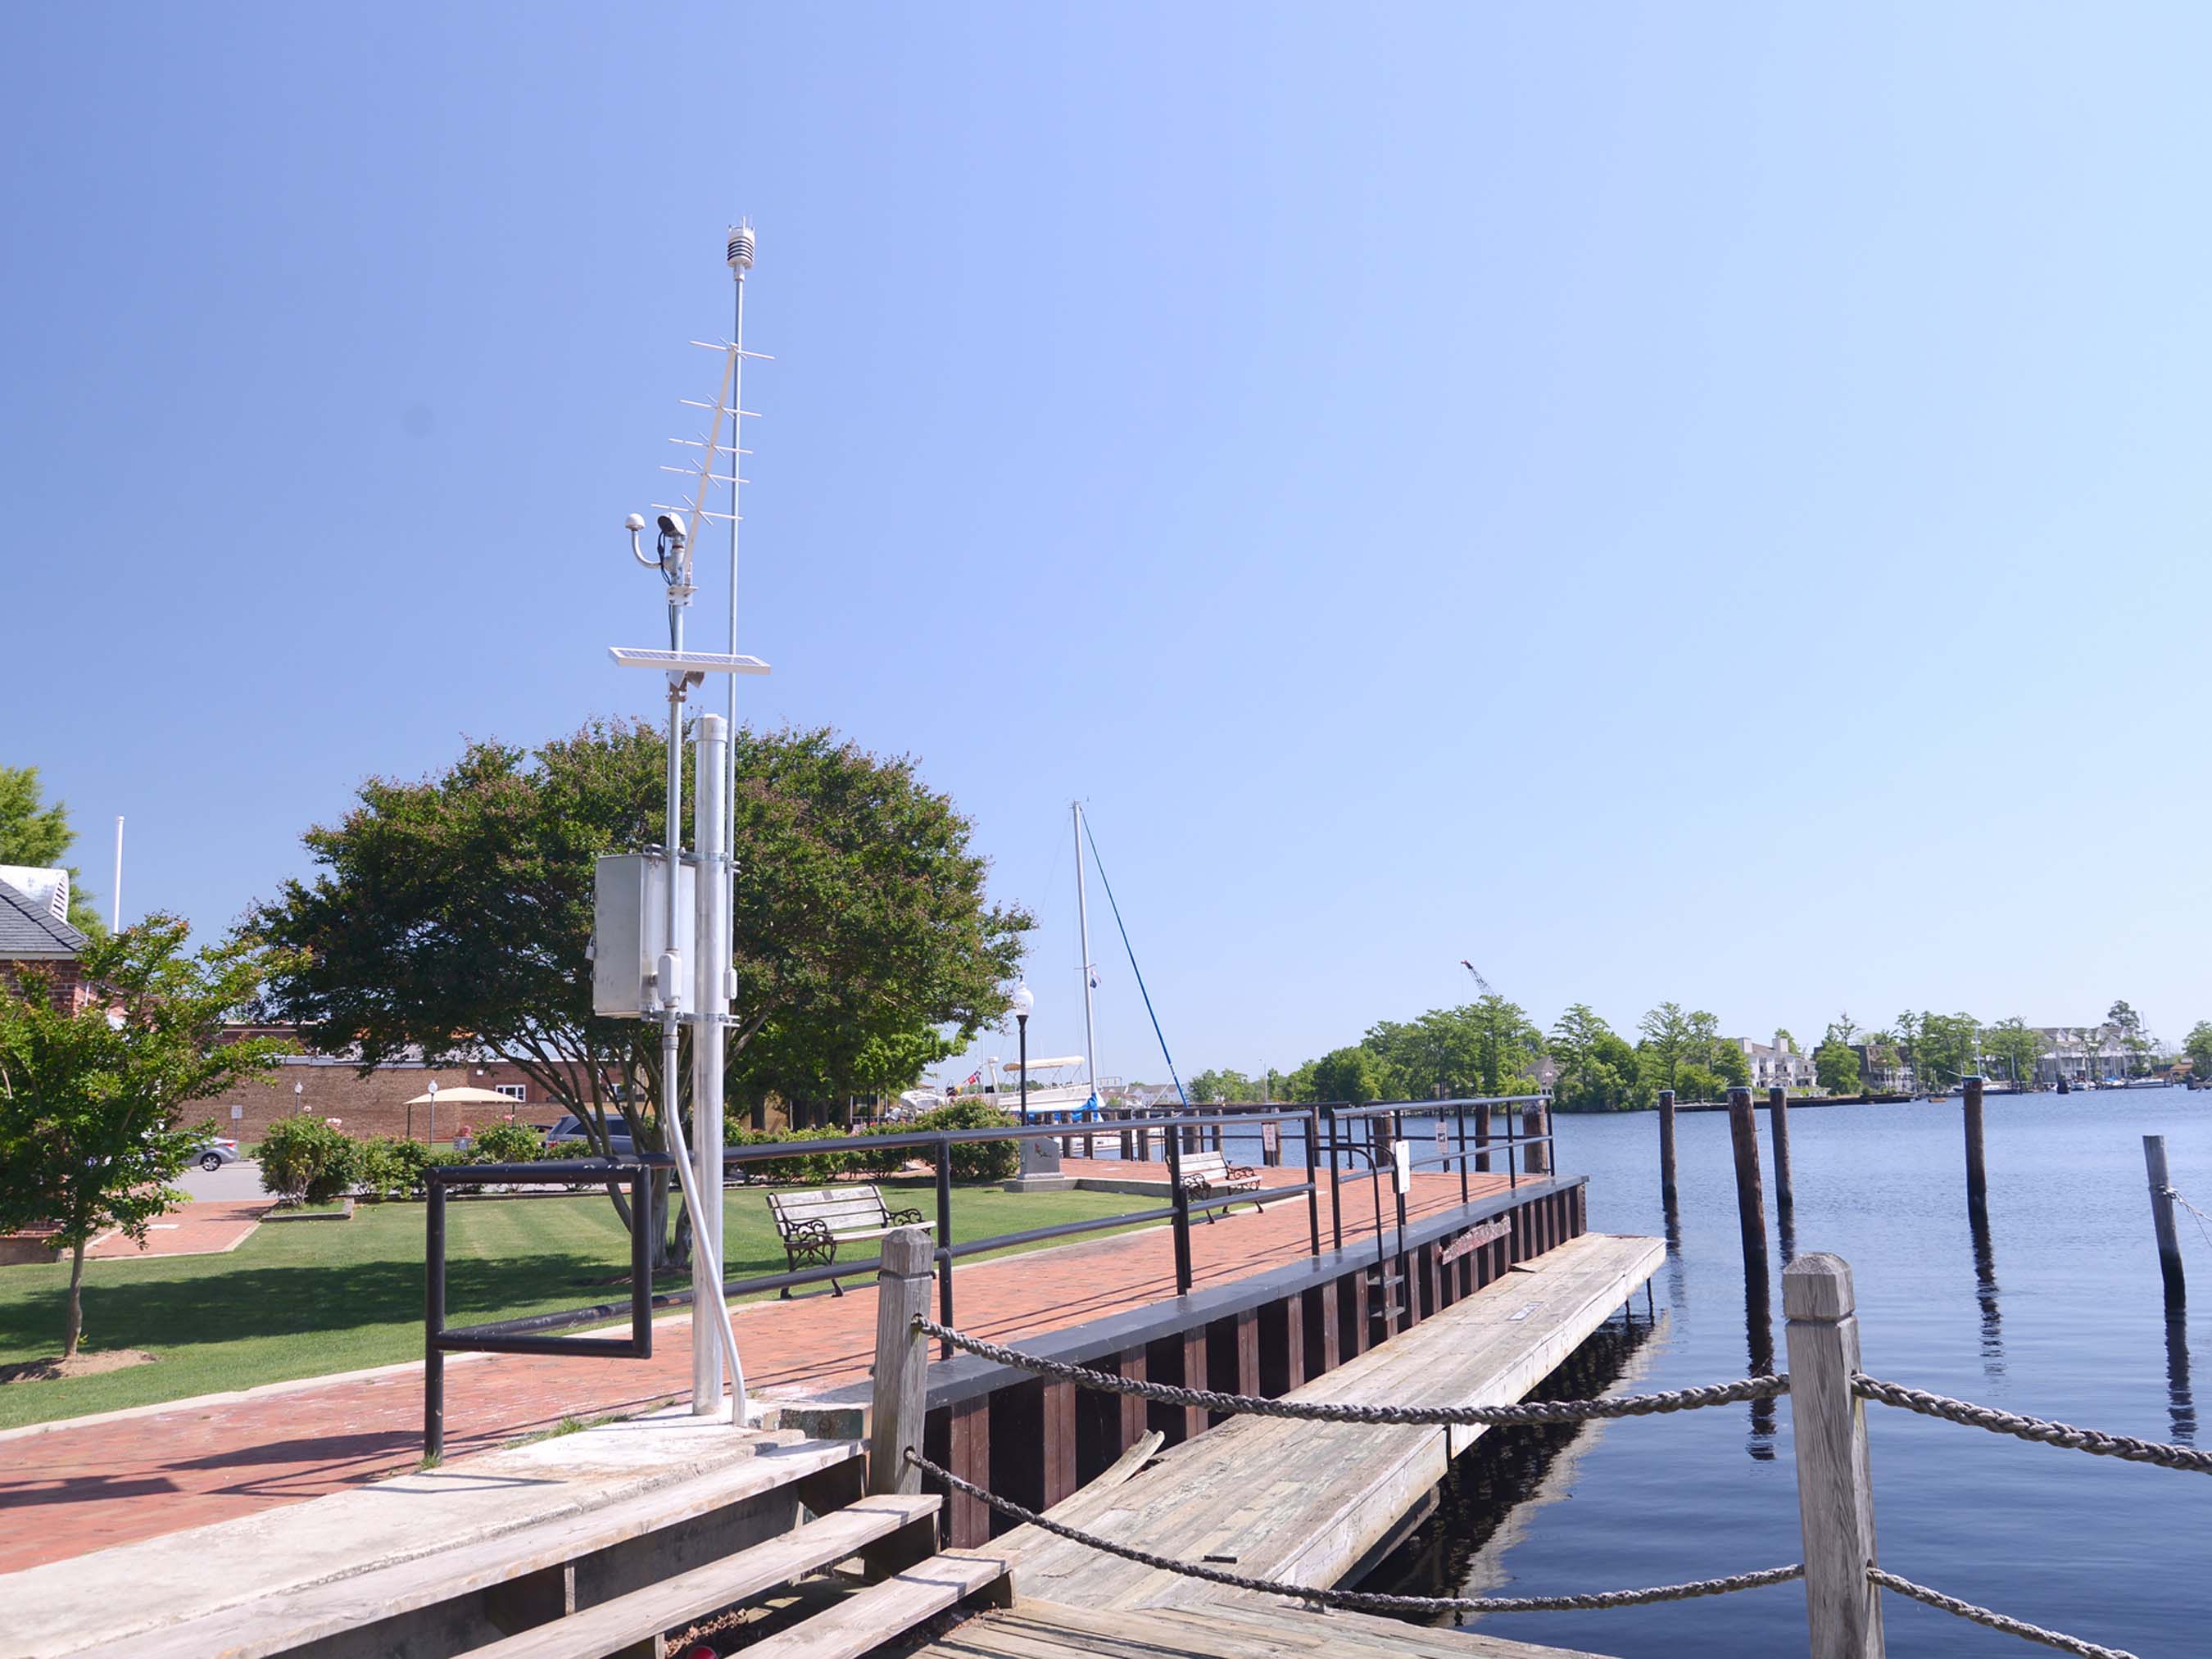
Pasquotank River near Mariners Wharf Park at Elizabeth City
Future / Actual / Minor
OWP 2.0 WWA Modal Title
01/11/2021, 10:04 PM UTC through 01/11/2021, 10:04 PM UTC
Sender
Sent
- Upstream gauge unavailableDownstream gauge unavailableWarning: no valid ratings curve available. Transformations to and from FEET/CFS/KCFS will not happen.No secondary data available. Transformations for Flow data and a secondary Y axis cannot be made at this time.
Traces and Thresholds Click to turn on/off display
Observed (OBS) 06/18/2025 1:50 PM EDTLow Threshold: -1 ftCATEGORY STAGE 
Major Flooding 3.5 ft Moderate Flooding 2.5 ft Minor Flooding 1.75 ft Action 1.5 ft Reliability of the Forecast:
NOTE: Forecasts are not available. Only observed stages are available for this point.
National Water Model Hydrograph
Official NWS streamflow forecasts are produced by NWS hydrologic forecasters for river gauge locations using hydrologic models which are calibrated to that location. This process considers additional guidance and information, including local expertise and experience, to produce the best forecast possible. The NWM output provides supplemental guidance to NWS forecasters and should not be considered an official NWS river forecast.
Flood Impacts
- 4 - The area between the Pasquotank River and Park St is becoming isolated as flood waters are cutting off access to all roads in and out of that area.
- 3.5 - Much of downtown is flooded including businesses along US 158, E. Grice Street, and Wharf Park. Numerous homes along Shepard St, Riverside Avenue, and Dawson St are flooded.
- 3 - Businesses along the water front in town begin to flood. Homes along Roanoke Ave are beginning to flood. Flooding is occurring along N. Road St, Walnut St and E Broad St.
- 2.5 - Numerous roads are flooded including US Hwy 158, E. Grice St, Herrington Rd and Park St. Homes along Dawson St and Hunter St are beginning to flood.
- 2 - The intersection of Water St. and Shepard St. is flooded and impassable with homes along Shepard St being impacted by flood waters.
- 1.75 - Portions of several roads, including Fairfax Ave, Shepard St, and Riverside Ave. are flooded and impassable. Water encroaches upon Charles Creek Park and Dog Corner Park. Flooding is occurring along N. Road St, Walnut St and E Broad St.
- 1.5 - Lowland areas along Charles Creek and Knobbs Creek begin to flood. Water begins to encroach upon Dawson St. and Fish Court Park.
Gauge Info
| Coordinates | 36.2986, -76.2186 |
| RFC | SERFC |
| State | NC |
| WFO | AKQ |
| County | Pasquotank |
| Data Provider(s) | |
| NC Department of Public Safety | NC Department of Public Safety |
Gauge Location
Recent Crests
| 1. | 1.90 ft | on 05-13-2025 | |
| 2. | 2.02 ft | on 09-27-2024 | (P) |
| 3. | 2.15 ft | on 08-02-2024 | (P) |
| 4. | 2.04 ft | on 07-25-2024 | (P) |
| 5. | 2.86 ft | on 04-12-2024 | (P) |
Recent Crests
| 1. | 1.90 ft | on 05-13-2025 | |
| 2. | 2.02 ft | on 09-27-2024 | (P) |
| 3. | 2.15 ft | on 08-02-2024 | (P) |
| 4. | 2.04 ft | on 07-25-2024 | (P) |
| 5. | 2.86 ft | on 04-12-2024 | (P) |
| 6. | 1.93 ft | on 04-11-2024 | (P) |
| 7. | 1.90 ft | on 03-23-2024 | (P) |
| 8. | 2.76 ft | on 01-10-2024 | |
| 9. | 1.77 ft | on 12-27-2023 | |
| 10. | 2.39 ft | on 12-18-2023 | |
| 11. | 1.85 ft | on 11-22-2023 | |
| 12. | 1.85 ft | on 10-21-2023 | |
| 13. | 2.02 ft | on 10-14-2023 | |
| 14. | 2.34 ft | on 09-23-2023 | |
| 15. | 2.01 ft | on 09-09-2023 | |
| 16. | 1.99 ft | on 08-17-2023 | |
| 17. | 2.19 ft | on 06-24-2023 | |
| 18. | 2.14 ft | on 04-30-2023 | |
| 19. | 2.32 ft | on 03-05-2023 | |
| 20. | 1.82 ft | on 11-12-2022 | |
| 21. | 1.94 ft | on 02-22-2021 | |
| 22. | 2.17 ft | on 12-24-2020 | |
| 23. | 1.87 ft | on 11-30-2020 | |
| 24. | 2.00 ft | on 10-29-2020 | |
| 25. | 3.75 ft | on 08-04-2020 | |
| 26. | 2.26 ft | on 04-30-2020 | |
| 27. | 3.09 ft | on 04-13-2020 | |
| 28. | 2.11 ft | on 10-16-2019 | |
| 29. | 1.67 ft | on 09-09-2019 | |
| 30. | 2.31 ft | on 04-20-2019 | |
| 31. | 1.75 ft | on 01-24-2019 | |
| 32. | 3.22 ft | on 10-11-2018 | |
| 33. | 2.43 ft | on 09-16-2018 | |
| 34. | 1.98 ft | on 07-24-2018 | |
| 35. | 1.96 ft | on 07-23-2018 | |
| 36. | 1.76 ft | on 04-16-2018 | |
| 37. | 1.83 ft | on 05-25-2017 | |
| 38. | 1.97 ft | on 05-05-2017 | |
| 39. | 2.04 ft | on 05-02-2017 | |
| 40. | 2.09 ft | on 04-06-2017 | |
| 41. | 1.83 ft | on 10-08-2016 | |
| 42. | 1.97 ft | on 10-03-2015 | |
| 43. | 1.95 ft | on 05-16-2014 |
Historic Crests
| 1. | 3.75 ft | on 08-04-2020 | |
| 2. | 3.22 ft | on 10-11-2018 | |
| 3. | 3.09 ft | on 04-13-2020 | |
| 4. | 2.86 ft | on 04-12-2024 | (P) |
| 5. | 2.76 ft | on 01-10-2024 |
Historic Crests
| 1. | 3.75 ft | on 08-04-2020 | |
| 2. | 3.22 ft | on 10-11-2018 | |
| 3. | 3.09 ft | on 04-13-2020 | |
| 4. | 2.86 ft | on 04-12-2024 | (P) |
| 5. | 2.76 ft | on 01-10-2024 | |
| 6. | 2.43 ft | on 09-16-2018 | |
| 7. | 2.39 ft | on 12-18-2023 | |
| 8. | 2.34 ft | on 09-23-2023 | |
| 9. | 2.32 ft | on 03-05-2023 | |
| 10. | 2.31 ft | on 04-20-2019 | |
| 11. | 2.26 ft | on 04-30-2020 | |
| 12. | 2.19 ft | on 06-24-2023 | |
| 13. | 2.17 ft | on 12-24-2020 | |
| 14. | 2.15 ft | on 08-02-2024 | (P) |
| 15. | 2.14 ft | on 04-30-2023 | |
| 16. | 2.11 ft | on 10-16-2019 | |
| 17. | 2.09 ft | on 04-06-2017 | |
| 18. | 2.04 ft | on 07-25-2024 | (P) |
| 19. | 2.04 ft | on 05-02-2017 | |
| 20. | 2.02 ft | on 10-14-2023 | |
| 21. | 2.02 ft | on 09-27-2024 | (P) |
| 22. | 2.01 ft | on 09-09-2023 | |
| 23. | 2.00 ft | on 10-29-2020 | |
| 24. | 1.99 ft | on 08-17-2023 | |
| 25. | 1.98 ft | on 07-24-2018 | |
| 26. | 1.97 ft | on 05-05-2017 | |
| 27. | 1.97 ft | on 10-03-2015 | |
| 28. | 1.96 ft | on 07-23-2018 | |
| 29. | 1.95 ft | on 05-16-2014 | |
| 30. | 1.94 ft | on 02-22-2021 | |
| 31. | 1.93 ft | on 04-11-2024 | (P) |
| 32. | 1.90 ft | on 03-23-2024 | (P) |
| 33. | 1.90 ft | on 05-13-2025 | |
| 34. | 1.87 ft | on 11-30-2020 | |
| 35. | 1.85 ft | on 11-22-2023 | |
| 36. | 1.85 ft | on 10-21-2023 | |
| 37. | 1.83 ft | on 05-25-2017 | |
| 38. | 1.83 ft | on 10-08-2016 | |
| 39. | 1.82 ft | on 11-12-2022 | |
| 40. | 1.77 ft | on 12-27-2023 | |
| 41. | 1.76 ft | on 04-16-2018 | |
| 42. | 1.75 ft | on 01-24-2019 | |
| 43. | 1.67 ft | on 09-09-2019 |
Vertical Datum Table
| type | NAVD88 |
|---|---|
| major Flooding | -0.10 ft |
| moderate Flooding | -1.10 ft |
| minor Flooding | -1.85 ft |
| action | -2.10 ft |
| Latest Value | -2.01 ft |
| Gauge Zero | -3.60 ft |


Probability Information
No Images Available
Unique Local Info
|
|
|
|
||||||
|
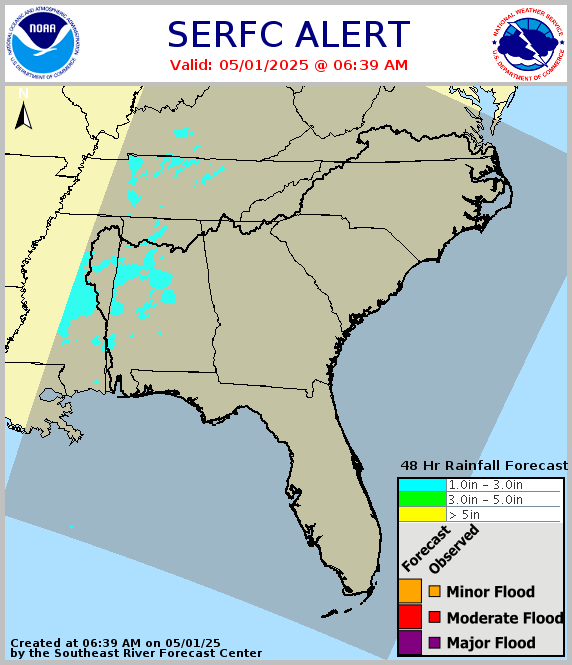
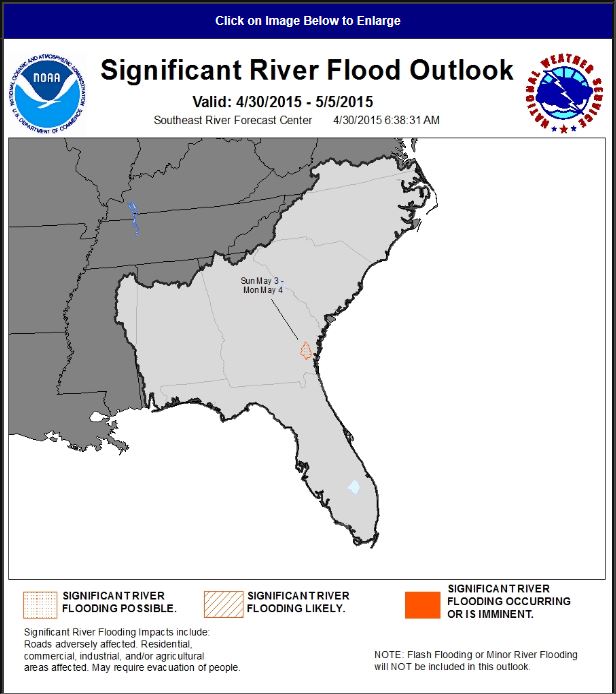
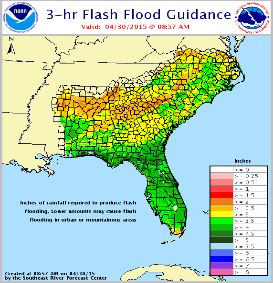
Additional Water and Weather Topics from the
Southeast River Forecast Center (SERFC): |
||||||||
Collaborative Agencies
The National Weather Service prepares its forecasts and other services in collaboration with agencies like the US Geological Survey, US Bureau of Reclamation, US Army Corps of Engineers, Natural Resource Conservation Service, National Park Service, ALERT Users Group, Bureau of Indian Affairs, and many state and local emergency managers across the country. For details, please click here.