Flatrock River at Columbus
Future / Actual / Minor
OWP 2.0 WWA Modal Title
01/11/2021, 10:04 PM UTC through 01/11/2021, 10:04 PM UTC
Sender
Sent
- Warning: no valid ratings curve available. Transformations to and from FEET/CFS/KCFS will not happen.
Traces and Thresholds Click to turn on/off display
Observed (OBS) 06/14/2025 11:30 AM EDTRecord: 19.9 ftLow Threshold: 0.031 kcfsCATEGORY STAGE 
Major Flooding 19 ft Moderate Flooding 15 ft Minor Flooding 11 ft Action 9 ft Reliability of the Forecast:
NOTE: Forecasts are issued as needed during times of high water, but are not routinely available.
National Water Model Hydrograph
Official NWS streamflow forecasts are produced by NWS hydrologic forecasters for river gauge locations using hydrologic models which are calibrated to that location. This process considers additional guidance and information, including local expertise and experience, to produce the best forecast possible. The NWM output provides supplemental guidance to NWS forecasters and should not be considered an official NWS river forecast.
Flood Impacts
- 21 - Diastrous flooding along the Flatrock River in the Columbus area affecting residential, business and commercial areas. US 31 and numeorous other state and local roads are closed. Flood waters more than 3 feet deep in some neighborhoods downstream of US 31. Approximate low steel for US Highway 31 bridge.
- 19.82 - During June 2008...Flatrock River at US 31 rose about 10 feet in 10 hours to cause a devastating flood to portions of the City of Columbus. US Highway 31 flooded as did Noblitt Lagoons and other neighborhoods. Water was 1 to 2 feet deep in many areas. This rise took place from Noon EDT to 10 pm EDT. The river was near bankfull before this tsunami like flood struck.
- 19.5 - Near recording flooding in progress along Flatrock River. CR 800 N remains open according to Columbus Response Plan.
Gauge Info
| Coordinates | 39.2350, -85.9267 |
| RFC | OHRFC |
| State | IN |
| WFO | IND |
| County | Bartholomew |
| Data Provider(s) | |
| US Geological Survey | USGS--Water Resources of the United States |
| USGS | 03363900 |
Gauge Location
Recent Crests
| 1. | 16.22 ft | on 04-06-2025 | (P) |
| 2. | 16.22 ft | on 04-06-2025 | (P) |
| 3. | 11.34 ft | on 04-11-2024 | (P) |
| 4. | 12.79 ft | on 03-26-2023 | (P) |
| 5. | 12.86 ft | on 03-08-2022 | (P) |
Recent Crests
| 1. | 16.22 ft | on 04-06-2025 | (P) |
| 2. | 16.22 ft | on 04-06-2025 | (P) |
| 3. | 11.34 ft | on 04-11-2024 | (P) |
| 4. | 12.79 ft | on 03-26-2023 | (P) |
| 5. | 12.86 ft | on 03-08-2022 | (P) |
| 6. | 13.37 ft | on 07-18-2021 | (P) |
| 7. | 14.58 ft | on 06-20-2021 | (P) |
| 8. | 15.25 ft | on 03-21-2020 | |
| 9. | 12.96 ft | on 01-13-2020 | (P) |
| 10. | 13.62 ft | on 06-18-2019 | |
| 11. | 11.93 ft | on 04-21-2019 | |
| 12. | 15.68 ft | on 02-08-2019 | |
| 13. | 12.18 ft | on 01-24-2019 | |
| 14. | 12.64 ft | on 11-03-2018 | |
| 15. | 10.72 ft | on 09-10-2018 | |
| 16. | 14.73 ft | on 04-04-2018 | |
| 17. | 13.55 ft | on 02-26-2018 | (P) |
| 18. | 9.30 ft | on 01-13-2018 | (P) |
| 19. | 10.82 ft | on 11-08-2017 | (P) |
| 20. | 10.47 ft | on 07-12-2017 | (P) |
| 21. | 11.19 ft | on 06-15-2017 | (P) |
| 22. | 9.72 ft | on 05-26-2017 | (P) |
| 23. | 12.92 ft | on 05-06-2017 | (P) |
| 24. | 11.59 ft | on 01-21-2017 | (P) |
| 25. | 9.02 ft | on 09-10-2016 | (P) |
| 26. | 11.20 ft | on 04-12-2016 | (P) |
| 27. | 10.65 ft | on 03-15-2016 | (P) |
| 28. | 13.04 ft | on 12-29-2015 | (P) |
| 29. | 11.59 ft | on 07-14-2015 | |
| 30. | 9.03 ft | on 06-21-2015 | |
| 31. | 12.62 ft | on 04-05-2014 | |
| 32. | 15.34 ft | on 12-23-2013 | |
| 33. | 12.15 ft | on 01-14-2013 | |
| 34. | 14.61 ft | on 04-21-2011 | |
| 35. | 13.47 ft | on 03-06-2011 | |
| 36. | 12.83 ft | on 06-23-2010 | |
| 37. | 12.94 ft | on 06-14-2010 | |
| 38. | 14.74 ft | on 08-05-2009 | |
| 39. | 11.06 ft | on 02-12-2009 | |
| 40. | 19.94 ft | on 06-07-2008 | |
| 41. | 14.40 ft | on 03-20-2008 | |
| 42. | 13.49 ft | on 02-07-2008 | |
| 43. | 11.91 ft | on 01-10-2008 | |
| 44. | 13.96 ft | on 01-16-2007 | |
| 45. | 16.45 ft | on 01-07-2005 |
Historic Crests
| 1. | 19.94 ft | on 06-07-2008 | |
| 2. | 16.45 ft | on 01-07-2005 | |
| 3. | 16.22 ft | on 04-06-2025 | (P) |
| 4. | 16.22 ft | on 04-06-2025 | (P) |
| 5. | 15.68 ft | on 02-08-2019 |
Historic Crests
| 1. | 19.94 ft | on 06-07-2008 | |
| 2. | 16.45 ft | on 01-07-2005 | |
| 3. | 16.22 ft | on 04-06-2025 | (P) |
| 4. | 16.22 ft | on 04-06-2025 | (P) |
| 5. | 15.68 ft | on 02-08-2019 | |
| 6. | 15.34 ft | on 12-23-2013 | |
| 7. | 15.25 ft | on 03-21-2020 | |
| 8. | 14.74 ft | on 08-05-2009 | |
| 9. | 14.73 ft | on 04-04-2018 | |
| 10. | 14.61 ft | on 04-21-2011 | |
| 11. | 14.58 ft | on 06-20-2021 | (P) |
| 12. | 14.40 ft | on 03-20-2008 | |
| 13. | 13.96 ft | on 01-16-2007 | |
| 14. | 13.62 ft | on 06-18-2019 | |
| 15. | 13.55 ft | on 02-26-2018 | (P) |
| 16. | 13.49 ft | on 02-07-2008 | |
| 17. | 13.47 ft | on 03-06-2011 | |
| 18. | 13.37 ft | on 07-18-2021 | (P) |
| 19. | 13.04 ft | on 12-29-2015 | (P) |
| 20. | 12.96 ft | on 01-13-2020 | (P) |
| 21. | 12.94 ft | on 06-14-2010 | |
| 22. | 12.92 ft | on 05-06-2017 | (P) |
| 23. | 12.86 ft | on 03-08-2022 | (P) |
| 24. | 12.83 ft | on 06-23-2010 | |
| 25. | 12.79 ft | on 03-26-2023 | (P) |
| 26. | 12.64 ft | on 11-03-2018 | |
| 27. | 12.62 ft | on 04-05-2014 | |
| 28. | 12.18 ft | on 01-24-2019 | |
| 29. | 12.15 ft | on 01-14-2013 | |
| 30. | 11.93 ft | on 04-21-2019 | |
| 31. | 11.91 ft | on 01-10-2008 | |
| 32. | 11.59 ft | on 01-21-2017 | (P) |
| 33. | 11.59 ft | on 07-14-2015 | |
| 34. | 11.34 ft | on 04-11-2024 | (P) |
| 35. | 11.20 ft | on 04-12-2016 | (P) |
| 36. | 11.19 ft | on 06-15-2017 | (P) |
| 37. | 11.06 ft | on 02-12-2009 | |
| 38. | 10.82 ft | on 11-08-2017 | (P) |
| 39. | 10.72 ft | on 09-10-2018 | |
| 40. | 10.65 ft | on 03-15-2016 | (P) |
| 41. | 10.47 ft | on 07-12-2017 | (P) |
| 42. | 9.72 ft | on 05-26-2017 | (P) |
| 43. | 9.30 ft | on 01-13-2018 | (P) |
| 44. | 9.03 ft | on 06-21-2015 | |
| 45. | 9.02 ft | on 09-10-2016 | (P) |
Low Water Records
Low Water Records
Vertical Datum Table
| type | NAVD88 |
|---|---|
| major Flooding | 628.67 ft |
| moderate Flooding | 624.67 ft |
| minor Flooding | 620.67 ft |
| action | 618.67 ft |
| Latest Value | 614.80 ft |
| Gauge Zero | 609.67 ft |


Unique Local Info
|
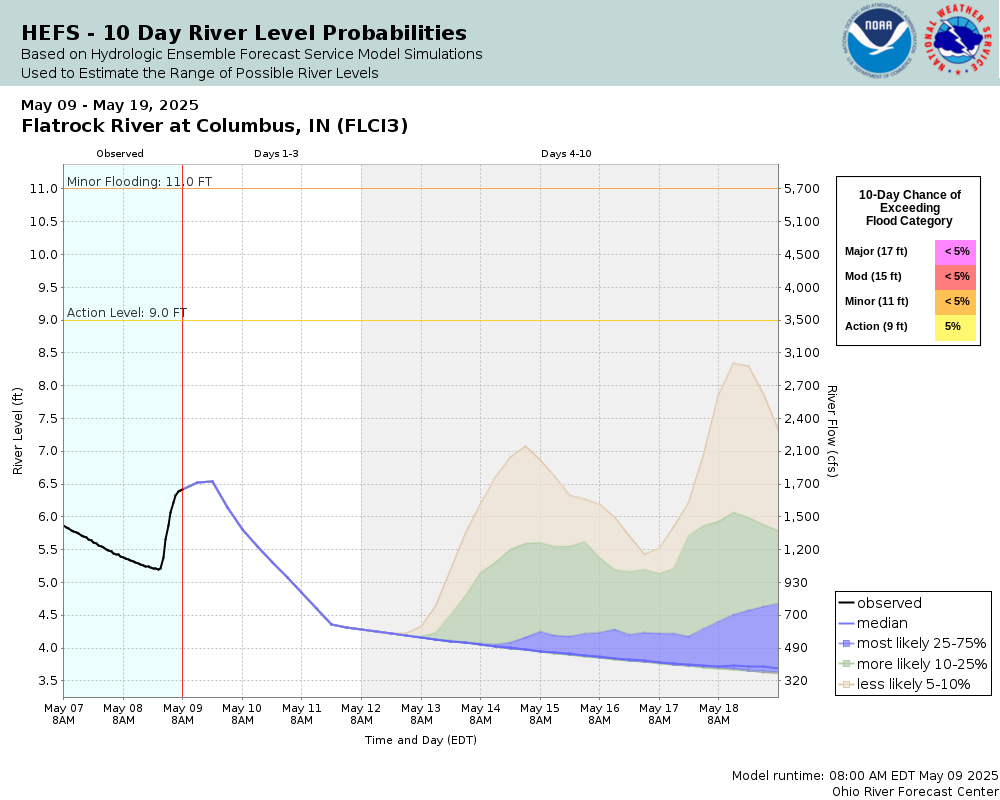
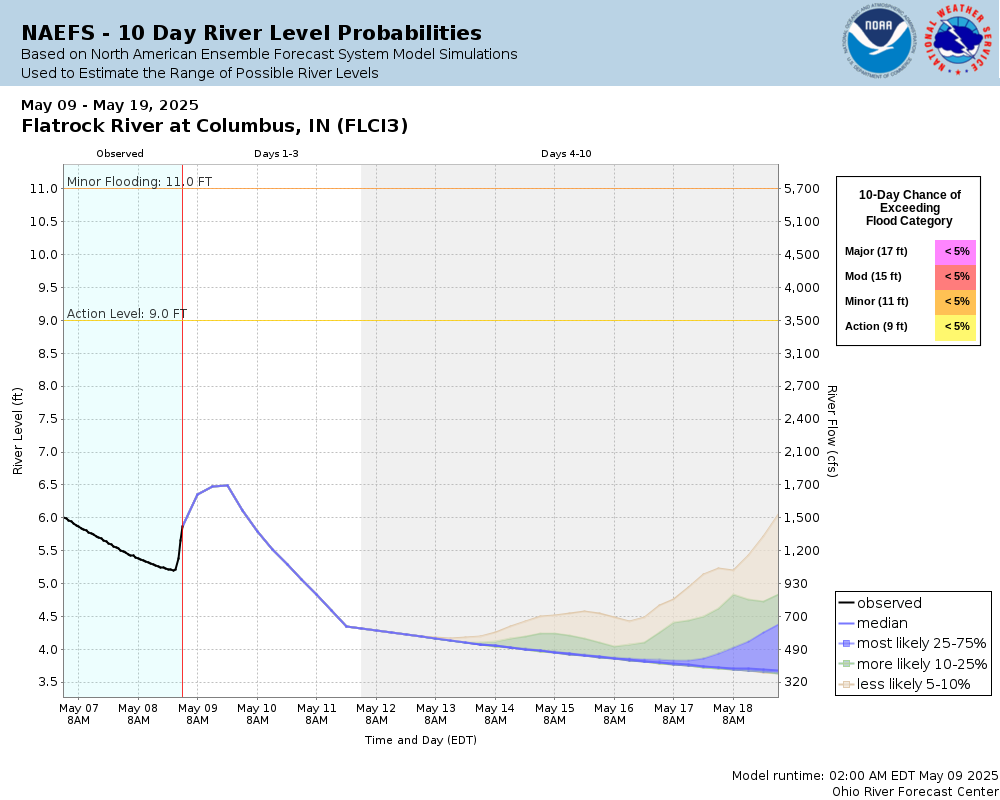
Potential River Levels Used to Estimate the Chance of Flooding and the Range of Possible River Levels |
||
| 10 Day (HEFS) | 10 Day (NAEFS) | 10 Day (GEFS) |
 |
 |
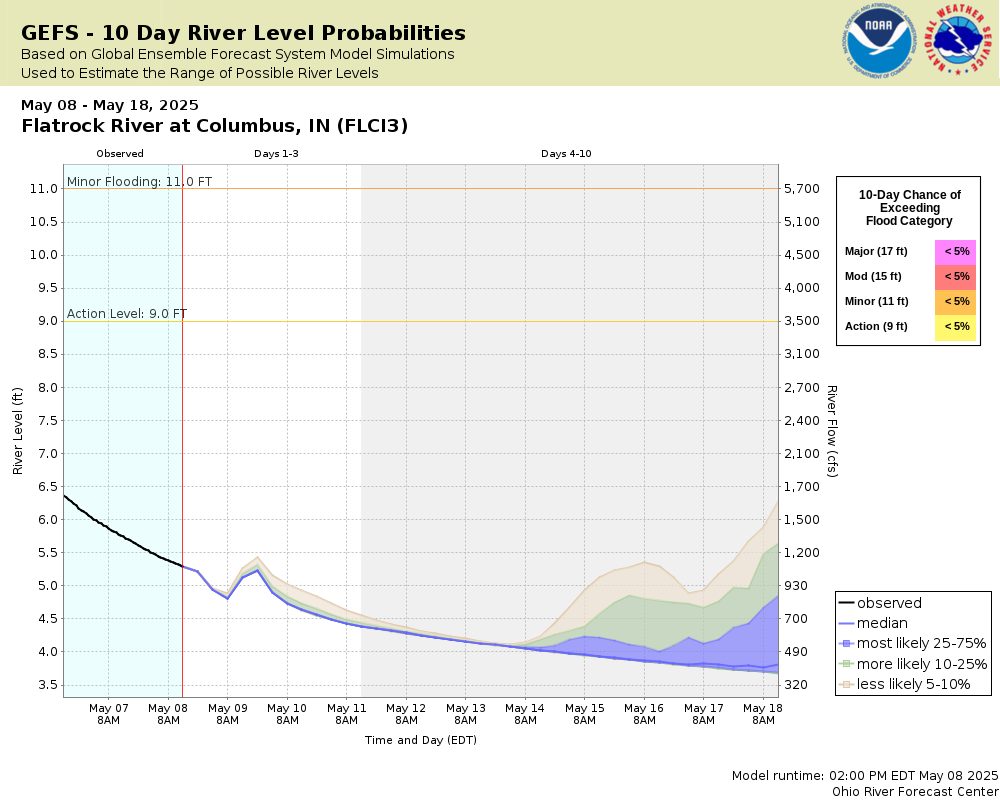 |
Note: Use the official hydrograph at the top of this web page for river levels within the next 72 hours.
Click individual graphics to enlarge.
Collaborative Agencies
The National Weather Service prepares its forecasts and other services in collaboration with agencies like the US Geological Survey, US Bureau of Reclamation, US Army Corps of Engineers, Natural Resource Conservation Service, National Park Service, ALERT Users Group, Bureau of Indian Affairs, and many state and local emergency managers across the country. For details, please click here.
Resources
Hydrologic Resource Links
- River Forecast Centers
- Text Products
- Forecast Precipitation
- US Geological Survey Surface Water
- How to Use US Geological Survey Water Alert Feature
- Water Resources Outlook
- Wabash River Conservation Area
- Water flow from Norway and Oakdale Dams
- Indianapolis Reservoir Levels
- Midwest Region U.S. Drought Monitor
- Indianapolis Museum of Art: FLOW Can You See the River?
- The Flood of 1913 - Remembered
- Friends of the White River
Additional Resource Links
- NWS Precipitation and River Forecasting
- Area Hydrographs
- Zoomable RFC Hourly Precipitation Maps
- Zoomable Snowfall Maps
- Indiana State Climate Office
- Community Collaborative Rain, Hail & Snow Network in Indiana
- Snow Information
- Midwestern Regional Climate Center
- Indiana Precipitation Frequencies
- Drainage Areas of Indiana Streams
- Ensemble River Forecasts
- Ohio River Forecast Center