Savannah River at Fort Pulaski (IN MLLW)
Future / Actual / Minor
OWP 2.0 WWA Modal Title
01/11/2021, 10:04 PM UTC through 01/11/2021, 10:04 PM UTC
Sender
Sent
- Downstream gauge unavailableWarning: no valid ratings curve available. Transformations to and from FEET/CFS/KCFS will not happen.
Traces and Thresholds Click to turn on/off display
Observed (OBS) 06/28/2025 11:18 AM EDTOfficial Forecast (FCST) 06/28/2025 9:16 AM EDTRecord: 12.6 ftLow Threshold: -2 ftCATEGORY STAGE 
Major Flooding 10.5 ft Moderate Flooding 10 ft Minor Flooding 9.5 ft Action 9.2 ft Reliability of the Forecast:
NOTE: Forecasts are issued routinely year-round.
During a Tropical Storm or Hurricane Watch or Warning, inundation mapping provided by the National Hurricane Center (go to the web site and select the storm of interest) reflects a reasonable worst case scenario. The forecast above is the total water forecast that is most likely to occur.
National Water Model Hydrograph
Official NWS streamflow forecasts are produced by NWS hydrologic forecasters for river gauge locations using hydrologic models which are calibrated to that location. This process considers additional guidance and information, including local expertise and experience, to produce the best forecast possible. The NWM output provides supplemental guidance to NWS forecasters and should not be considered an official NWS river forecast.
Flood Impacts
- 12.56 - Record tide level reached in association with Hurricane Matthew which made landfall near McClellanville, SC as a Category 1 hurricane on October 8th, 2016.
- 12.24 - Peak tide level reached in association with Tropical Storm Irma on September 11th, 2017.
- 10.86 - Peak tide level reached in association with an unnamed hurricane that made landfall near Ossabaw Island, GA as a Category 2 hurricane on October 15th, 1947.
- 10.5 - At 10.5 ft MLLW, major coastal flooding occurs. Damaging flooding is expected, expanding along the entire southeast Georgia coast. Flooding will likely cause the closure of HW-80, isolating residents on Tybee Island. Several other island communities will also likely become isolated due to flooded and impassable roadways. On Tybee Island, widespread significant flooding is expected with numerous properties impacted.
- 10.4 - Peak tide level reached in association with an unnamed hurricane that made landfall near Hilton Head Island, SC as a Category 2 hurricane on August 11th, 1940.
- 10.02 - Peak tide level reached in association with Tropical Storm Gabrielle as it moved away from the Southeast coast on September 16th, 2001.
- 10 - At 10.0 ft MLLW, moderate coastal flooding occurs. Shipyard Rd will be impassable, isolating residents on Burnside Island. Water will start to encroach on HW-80 and as the tide gets closer to 10.5 ft MLLW, could begin to cover portions of the roadway. Flooding will expand on Tybee Island and Catalina Dr and Lewis Ave will be impassable. Flooding will also impact Wilmington Island, the Coffee Bluff community, Ossabaw Island, Sapelo Island, and portions of HW-17 south of Darien.
- 9.5 - At 9.5 ft MLLW, minor coastal flooding occurs. Flooding will begin to impact Shipyard Road to Burnside Island. Parts of Ft Pulaski National Monument will begin to flood, including several trails. Flooding will also begin to impact Tybee Island including Catalina Dr and Lewis Ave. In Bryan County, water could breach docks near Ft McAllister and flooding will impact portions of Mill Hill Rd. In Liberty County, flooding impacts the Halfmoon Landing area and Cattle Hammock Rd near Bermuda Bluff subdivision.
Gauge Location
Recent Crests
| 1. | 9.96 ft | on 04-27-2025 | (P) |
| 2. | 10.17 ft | on 11-16-2024 | |
| 3. | 10.25 ft | on 11-14-2024 | |
| 4. | 9.84 ft | on 09-27-2024 | |
| 5. | 10.07 ft | on 12-17-2023 |
Recent Crests
| 1. | 9.96 ft | on 04-27-2025 | (P) |
| 2. | 10.17 ft | on 11-16-2024 | |
| 3. | 10.25 ft | on 11-14-2024 | |
| 4. | 9.84 ft | on 09-27-2024 | |
| 5. | 10.07 ft | on 12-17-2023 | |
| 6. | 9.93 ft | on 09-29-2023 | |
| 7. | 9.94 ft | on 09-28-2023 | |
| 8. | 9.95 ft | on 09-27-2023 | |
| 9. | 9.90 ft | on 08-31-2023 | |
| 10. | 10.00 ft | on 08-02-2023 | |
| 11. | 9.92 ft | on 06-05-2023 | |
| 12. | 10.20 ft | on 06-04-2023 | |
| 13. | 9.81 ft | on 06-03-2023 | |
| 14. | 10.41 ft | on 11-10-2022 | |
| 15. | 10.02 ft | on 09-09-2022 | |
| 16. | 10.11 ft | on 11-08-2021 | |
| 17. | 10.45 ft | on 11-07-2021 | |
| 18. | 10.00 ft | on 11-05-2021 | |
| 19. | 9.96 ft | on 11-15-2020 | |
| 20. | 10.02 ft | on 10-18-2020 | |
| 21. | 9.81 ft | on 09-20-2020 | |
| 22. | 10.00 ft | on 09-19-2020 | |
| 23. | 9.84 ft | on 09-15-2020 | |
| 24. | 10.02 ft | on 08-31-2019 | |
| 25. | 10.06 ft | on 08-30-2019 | |
| 26. | 10.05 ft | on 08-29-2019 | |
| 27. | 9.90 ft | on 08-02-2019 | |
| 28. | 9.86 ft | on 02-20-2019 | |
| 29. | 9.94 ft | on 02-19-2019 | |
| 30. | 10.04 ft | on 11-24-2018 | |
| 31. | 10.25 ft | on 11-23-2018 | |
| 32. | 12.23 ft | on 09-11-2017 | |
| 33. | 9.82 ft | on 11-14-2016 | |
| 34. | 10.18 ft | on 11-13-2016 | |
| 35. | 12.56 ft | on 10-08-2016 | |
| 36. | 9.90 ft | on 10-28-2015 | |
| 37. | 10.43 ft | on 10-27-2015 | |
| 38. | 9.94 ft | on 10-03-2015 | |
| 39. | 9.82 ft | on 09-29-2015 | |
| 40. | 9.90 ft | on 05-07-2012 | |
| 41. | 9.95 ft | on 01-30-2010 | |
| 42. | 10.07 ft | on 06-23-2009 | |
| 43. | 10.11 ft | on 06-22-2009 | |
| 44. | 9.85 ft | on 10-05-2005 | |
| 45. | 10.02 ft | on 09-16-2001 | |
| 46. | 9.91 ft | on 07-21-2001 | |
| 47. | 10.26 ft | on 02-07-1993 | |
| 48. | 9.87 ft | on 11-13-1981 | |
| 49. | 10.15 ft | on 12-03-1971 | |
| 50. | 10.86 ft | on 10-15-1947 | |
| 51. | 10.40 ft | on 08-11-1940 |
Historic Crests
| 1. | 12.56 ft | on 10-08-2016 |
| 2. | 12.23 ft | on 09-11-2017 |
| 3. | 10.86 ft | on 10-15-1947 |
| 4. | 10.45 ft | on 11-07-2021 |
| 5. | 10.43 ft | on 10-27-2015 |
Historic Crests
| 1. | 12.56 ft | on 10-08-2016 | |
| 2. | 12.23 ft | on 09-11-2017 | |
| 3. | 10.86 ft | on 10-15-1947 | |
| 4. | 10.45 ft | on 11-07-2021 | |
| 5. | 10.43 ft | on 10-27-2015 | |
| 6. | 10.41 ft | on 11-10-2022 | |
| 7. | 10.40 ft | on 08-11-1940 | |
| 8. | 10.26 ft | on 02-07-1993 | |
| 9. | 10.25 ft | on 11-23-2018 | |
| 10. | 10.25 ft | on 11-14-2024 | |
| 11. | 10.20 ft | on 06-04-2023 | |
| 12. | 10.18 ft | on 11-13-2016 | |
| 13. | 10.17 ft | on 11-16-2024 | |
| 14. | 10.15 ft | on 12-03-1971 | |
| 15. | 10.11 ft | on 11-08-2021 | |
| 16. | 10.11 ft | on 06-22-2009 | |
| 17. | 10.07 ft | on 12-17-2023 | |
| 18. | 10.07 ft | on 06-23-2009 | |
| 19. | 10.06 ft | on 08-30-2019 | |
| 20. | 10.05 ft | on 08-29-2019 | |
| 21. | 10.04 ft | on 11-24-2018 | |
| 22. | 10.02 ft | on 10-18-2020 | |
| 23. | 10.02 ft | on 08-31-2019 | |
| 24. | 10.02 ft | on 09-09-2022 | |
| 25. | 10.02 ft | on 09-16-2001 | |
| 26. | 10.00 ft | on 09-19-2020 | |
| 27. | 10.00 ft | on 11-05-2021 | |
| 28. | 10.00 ft | on 08-02-2023 | |
| 29. | 9.96 ft | on 04-27-2025 | (P) |
| 30. | 9.96 ft | on 11-15-2020 | |
| 31. | 9.95 ft | on 09-27-2023 | |
| 32. | 9.95 ft | on 01-30-2010 | |
| 33. | 9.94 ft | on 10-03-2015 | |
| 34. | 9.94 ft | on 09-28-2023 | |
| 35. | 9.94 ft | on 02-19-2019 | |
| 36. | 9.93 ft | on 09-29-2023 | |
| 37. | 9.92 ft | on 06-05-2023 | |
| 38. | 9.91 ft | on 07-21-2001 | |
| 39. | 9.90 ft | on 10-28-2015 | |
| 40. | 9.90 ft | on 05-07-2012 | |
| 41. | 9.90 ft | on 08-31-2023 | |
| 42. | 9.90 ft | on 08-02-2019 | |
| 43. | 9.87 ft | on 11-13-1981 | |
| 44. | 9.86 ft | on 02-20-2019 | |
| 45. | 9.85 ft | on 10-05-2005 | |
| 46. | 9.84 ft | on 09-27-2024 | |
| 47. | 9.84 ft | on 09-15-2020 | |
| 48. | 9.82 ft | on 09-29-2015 | |
| 49. | 9.82 ft | on 11-14-2016 | |
| 50. | 9.81 ft | on 06-03-2023 | |
| 51. | 9.81 ft | on 09-20-2020 |
Low Water Records
| 1. | -4.60 ft | on 03-21-1936 |
| 2. | -4.19 ft | on 03-13-1993 |
| 3. | -4.10 ft | on 03-03-1942 |
| 4. | -3.99 ft | on 02-15-1953 |
| 5. | -3.99 ft | on 01-24-1940 |
Low Water Records
| 1. | -4.60 ft | on 03-21-1936 |
| 2. | -4.19 ft | on 03-13-1993 |
| 3. | -4.10 ft | on 03-03-1942 |
| 4. | -3.99 ft | on 02-15-1953 |
| 5. | -3.99 ft | on 01-24-1940 |
| 6. | -3.99 ft | on 11-30-1963 |
| 7. | -3.79 ft | on 12-01-1963 |
| 8. | -3.70 ft | on 04-07-1989 |
| 9. | -3.53 ft | on 03-08-2005 |
| 10. | -3.50 ft | on 02-25-1967 |
| 11. | -3.47 ft | on 03-14-1941 |
| 12. | -3.46 ft | on 02-19-1972 |
| 13. | -3.37 ft | on 04-16-2007 |
| 14. | -3.25 ft | on 01-03-2014 |
| 15. | -3.20 ft | on 03-17-1936 |
| 16. | -3.13 ft | on 01-09-1978 |
| 17. | -3.10 ft | on 12-21-1960 |
| 18. | -3.10 ft | on 01-10-1978 |
| 19. | -3.10 ft | on 01-09-1970 |
| 20. | -3.10 ft | on 11-02-1963 |
| 21. | -3.10 ft | on 02-02-1958 |
| 22. | -3.10 ft | on 01-25-1940 |
| 23. | -3.10 ft | on 03-07-1939 |
| 24. | -3.10 ft | on 12-06-1938 |
| 25. | -3.08 ft | on 03-20-1996 |
| 26. | -3.07 ft | on 03-08-2008 |
| 27. | -3.04 ft | on 04-15-1980 |
| 28. | -3.04 ft | on 03-19-1996 |
| 29. | -3.02 ft | on 12-12-2008 |
| 30. | -3.01 ft | on 01-14-1982 |
| 31. | -3.00 ft | on 01-27-1971 |
| 32. | -3.00 ft | on 03-04-1954 |
| 33. | -3.00 ft | on 04-21-1940 |
| 34. | -3.00 ft | on 01-08-1962 |
| 35. | -3.00 ft | on 12-10-1954 |
Vertical Datum Table
| type | MLLW* | MLW | MSL | MHW | MHHW* | NAVD88 |
|---|---|---|---|---|---|---|
| major Flooding | 10.50 ft | 10.29 ft | 6.68 ft | 3.37 ft | 3.00 ft | 6.45 ft |
| moderate Flooding | 10.00 ft | 9.79 ft | 6.18 ft | 2.87 ft | 2.50 ft | 5.95 ft |
| minor Flooding | 9.50 ft | 9.29 ft | 5.68 ft | 2.37 ft | 2.00 ft | 5.45 ft |
| action | 9.20 ft | 8.99 ft | 5.38 ft | 2.07 ft | 1.70 ft | 5.15 ft |
| Latest Value | 7.34 ft | 7.13 ft | 3.52 ft | 0.21 ft | -0.16 ft | 3.29 ft |
| Gauge Zero | 0.00 ft | -0.21 ft | -3.82 ft | -7.13 ft | -7.50 ft | -4.05 ft |
Gauge Photos
No Images Found
Probability Information
No Images Available
Unique Local Info
Gage data plotted here is referenced to Mean Lower Low Water (MLLW). Click here to view other datums as well as the astronomical tide predictions for Fort Pulaski. These predictions do not incorporate effects such as wind which can increase values by as much as 2 ft during non-tropical events.
|
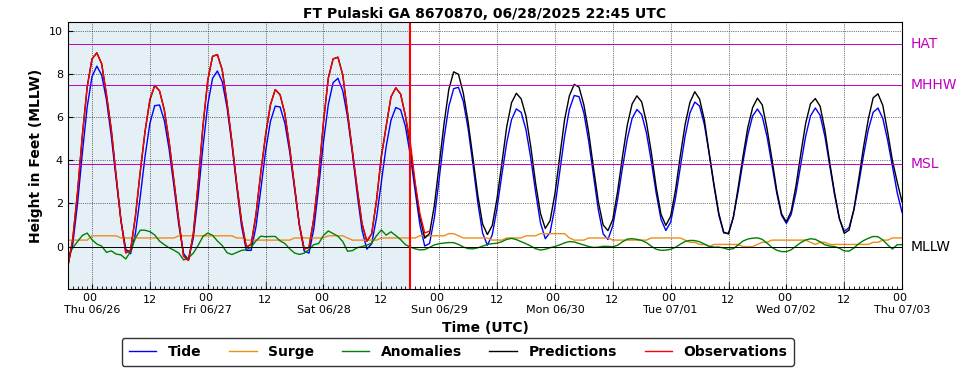
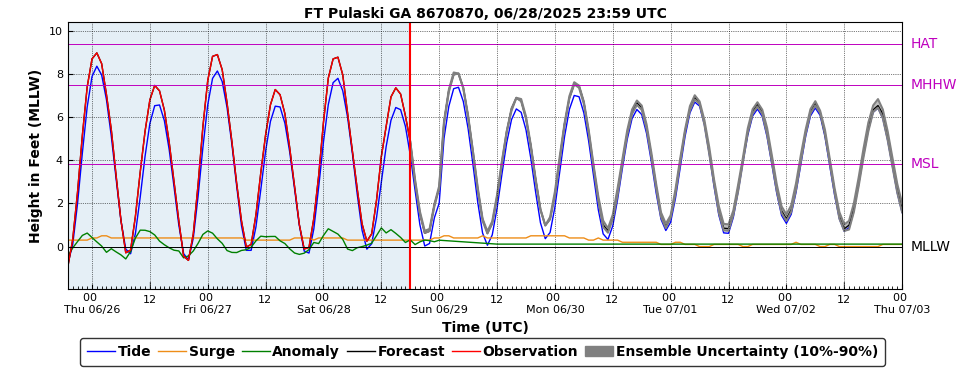
Potential Tide Levels Used to Estimate the Chance of Flooding and the Range of Possible Tide Levels |
||
| GFS Based Guidance (ETSS) | GEFS Based Guidance (P-ETSS) | NAEFS Based Guidance (P-ETSS) |
 |
 |
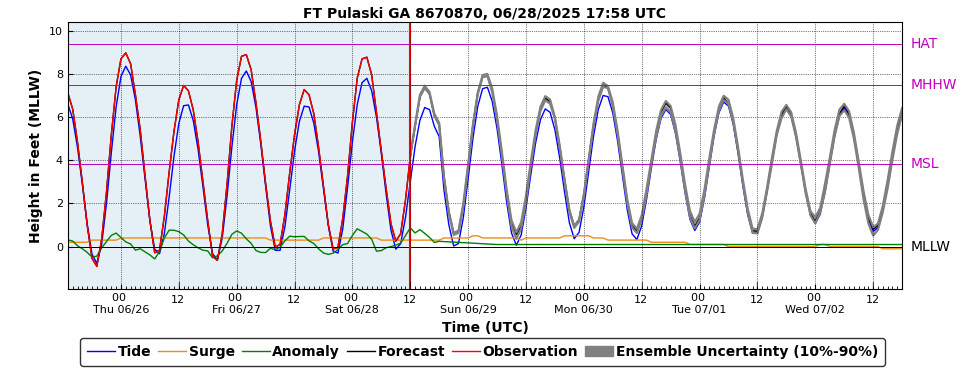 |
Note: Use the official hydrograph at the top of this web page for tide levels within the next 72 hours.
The Potential Tide Level graphics above are from an EXPERIMENTAL web site. It is supported on an 8x5 basis, and has no guarantee of availability in the future. Please see information HERE to understand the strengths and weakness of the Potential Tide Level graphics. Click individual graphics to enlarge.
Collaborative Agencies
The National Weather Service prepares its forecasts and other services in collaboration with agencies like the US Geological Survey, US Bureau of Reclamation, US Army Corps of Engineers, Natural Resource Conservation Service, National Park Service, ALERT Users Group, Bureau of Indian Affairs, and many state and local emergency managers across the country. For details, please click here.