Saluda River above Old Easley Hwy (SC 124), 5 WSW Greenville
Future / Actual / Minor
OWP 2.0 WWA Modal Title
01/11/2021, 10:04 PM UTC through 01/11/2021, 10:04 PM UTC
Sender
Sent
- Upstream gauge unavailableWarning: no valid ratings curve available. Transformations to and from FEET/CFS/KCFS will not happen.
Traces and Thresholds Click to turn on/off display
Observed (OBS) 06/05/2025 3:45 AM EDTOfficial Forecast (FCST) 06/04/2025 8:55 AM EDTRecord: 20.3 ftLow Threshold: 0 ftCATEGORY STAGE 
Major Flooding 15 ft Moderate Flooding 13 ft Minor Flooding 9.5 ft Action 8 ft Reliability of the Forecast: Forecast data shown here are guidance values only. Please refer to your local NWS office.
NOTE: Forecasts are issued routinely year-round.
Gauge reading affected by reservoir operations.
National Water Model Hydrograph
Official NWS streamflow forecasts are produced by NWS hydrologic forecasters for river gauge locations using hydrologic models which are calibrated to that location. This process considers additional guidance and information, including local expertise and experience, to produce the best forecast possible. The NWM output provides supplemental guidance to NWS forecasters and should not be considered an official NWS river forecast.
Flood Impacts
- 16.12 - ...impacts continued from the 16.12 statement... Floodwaters have likely submerged the crawl spaces of mobile homes closest to the Saluda River near the intersection of Shady Acres Cir and Old Easley Bridge Rd. Floodwaters are likely impacting basements, mobile homes, and permanent RVs along the 3900-4200 block of Old Easley Bridge Rd. Floodwaters approximately 2-4 feet deep are inundating River Rd near Myers Ln. Significant residential yard flooding is occurring on Lakeview Dr and Birch River Rd.
- 16.11 - ...impacts continued from the 16.1 statement... Floodwaters may be entering the first-floor elevation at 24 Riverview Cir. 19 Riverview Cir may have 1-2 feet of floodwaters in its crawl space. Extensive floodwaters are surrounding other homes on Riverview Cir, reaching 1-2 feet deep in adjacents garages and outbuildings. Riverview Cir will also be flooded with up to 1-3 feet of floodwaters. Impacts continued in the 16.12 statement...
- 16.1 - Major Flood Stage continues. The Saluda River has reached the highest levels seen in the modern era. The Saluda River crested at 16.13 ft on February 6, 2020. Floodwaters of 1-3 feet deep may be inundating buildings closest to the river on Shop Ct. Floodwaters of at least 1 foot deep are inundating the lowest elevations of Riverview Dr near the intersection with Knollview Dr and the lowest elevations of adjacent residential yards with several feet of water. Impacts continued in the 16.11 statement...
Gauge Info
| Coordinates | 34.8423, -82.4807 |
| RFC | SERFC |
| State | SC |
| WFO | GSP |
| County | Pickens |
| Data Provider(s) | |
| US Geological Survey | USGS--Water Resources of the United States |
| USGS | 02162500 |
Gauge Location
Recent Crests
| 1. | 20.26 ft | on 09-28-2024 |
| 2. | 10.25 ft | on 01-10-2024 |
| 3. | 16.13 ft | on 02-07-2020 |
| 4. | 6.75 ft | on 05-06-2013 |
| 5. | 6.42 ft | on 05-14-2012 |
Recent Crests
| 1. | 20.26 ft | on 09-28-2024 |
| 2. | 10.25 ft | on 01-10-2024 |
| 3. | 16.13 ft | on 02-07-2020 |
| 4. | 6.75 ft | on 05-06-2013 |
| 5. | 6.42 ft | on 05-14-2012 |
| 6. | 6.96 ft | on 12-01-2010 |
| 7. | 9.72 ft | on 01-25-2010 |
| 8. | 7.11 ft | on 11-12-2009 |
| 9. | 9.37 ft | on 03-02-2007 |
| 10. | 7.85 ft | on 06-27-2006 |
| 11. | 12.03 ft | on 07-08-2005 |
| 12. | 6.87 ft | on 09-18-2004 |
| 13. | 15.07 ft | on 09-09-2004 |
| 14. | 9.43 ft | on 03-20-2003 |
| 15. | 12.28 ft | on 01-09-1998 |
| 16. | 10.70 ft | on 01-27-1996 |
| 17. | 15.59 ft | on 08-27-1995 |
| 18. | 14.78 ft | on 08-18-1994 |
| 19. | 14.48 ft | on 03-17-1990 |
| 20. | 11.38 ft | on 03-30-1977 |
| 21. | 10.90 ft | on 10-09-1976 |
| 22. | 11.39 ft | on 09-18-1975 |
| 23. | 13.78 ft | on 03-14-1975 |
| 24. | 12.63 ft | on 05-28-1973 |
| 25. | 14.19 ft | on 08-24-1967 |
| 26. | 10.62 ft | on 02-14-1966 |
| 27. | 18.14 ft | on 10-05-1964 |
| 28. | 10.43 ft | on 03-06-1963 |
| 29. | 12.04 ft | on 12-12-1961 |
| 30. | 15.43 ft | on 06-23-1961 |
| 31. | 15.05 ft | on 01-23-1954 |
| 32. | 10.94 ft | on 03-23-1952 |
| 33. | 19.38 ft | on 10-07-1949 |
| 34. | 14.48 ft | on 01-08-1946 |
| 35. | 11.01 ft | on 12-30-1942 |
| 36. | 11.63 ft | on 02-17-1942 |
Historic Crests
| 1. | 20.26 ft | on 09-28-2024 |
| 2. | 19.38 ft | on 10-07-1949 |
| 3. | 18.14 ft | on 10-05-1964 |
| 4. | 16.13 ft | on 02-07-2020 |
| 5. | 15.59 ft | on 08-27-1995 |
Historic Crests
| 1. | 20.26 ft | on 09-28-2024 |
| 2. | 19.38 ft | on 10-07-1949 |
| 3. | 18.14 ft | on 10-05-1964 |
| 4. | 16.13 ft | on 02-07-2020 |
| 5. | 15.59 ft | on 08-27-1995 |
| 6. | 15.43 ft | on 06-23-1961 |
| 7. | 15.07 ft | on 09-09-2004 |
| 8. | 15.05 ft | on 01-23-1954 |
| 9. | 14.78 ft | on 08-18-1994 |
| 10. | 14.48 ft | on 01-08-1946 |
| 11. | 14.48 ft | on 03-17-1990 |
| 12. | 14.19 ft | on 08-24-1967 |
| 13. | 13.78 ft | on 03-14-1975 |
| 14. | 12.63 ft | on 05-28-1973 |
| 15. | 12.28 ft | on 01-09-1998 |
| 16. | 12.04 ft | on 12-12-1961 |
| 17. | 12.03 ft | on 07-08-2005 |
| 18. | 11.63 ft | on 02-17-1942 |
| 19. | 11.39 ft | on 09-18-1975 |
| 20. | 11.38 ft | on 03-30-1977 |
| 21. | 11.01 ft | on 12-30-1942 |
| 22. | 10.94 ft | on 03-23-1952 |
| 23. | 10.90 ft | on 10-09-1976 |
| 24. | 10.70 ft | on 01-27-1996 |
| 25. | 10.62 ft | on 02-14-1966 |
| 26. | 10.43 ft | on 03-06-1963 |
| 27. | 10.25 ft | on 01-10-2024 |
| 28. | 9.72 ft | on 01-25-2010 |
| 29. | 9.43 ft | on 03-20-2003 |
| 30. | 9.37 ft | on 03-02-2007 |
| 31. | 7.85 ft | on 06-27-2006 |
| 32. | 7.11 ft | on 11-12-2009 |
| 33. | 6.96 ft | on 12-01-2010 |
| 34. | 6.87 ft | on 09-18-2004 |
| 35. | 6.75 ft | on 05-06-2013 |
| 36. | 6.42 ft | on 05-14-2012 |
Vertical Datum Table
| type | NGVD29 |
|---|---|
| major Flooding | 812.48 ft |
| moderate Flooding | 810.48 ft |
| minor Flooding | 806.98 ft |
| action | 805.48 ft |
| Latest Value | 800.54 ft |
| Gauge Zero | 797.48 ft |


Unique Local Info
|
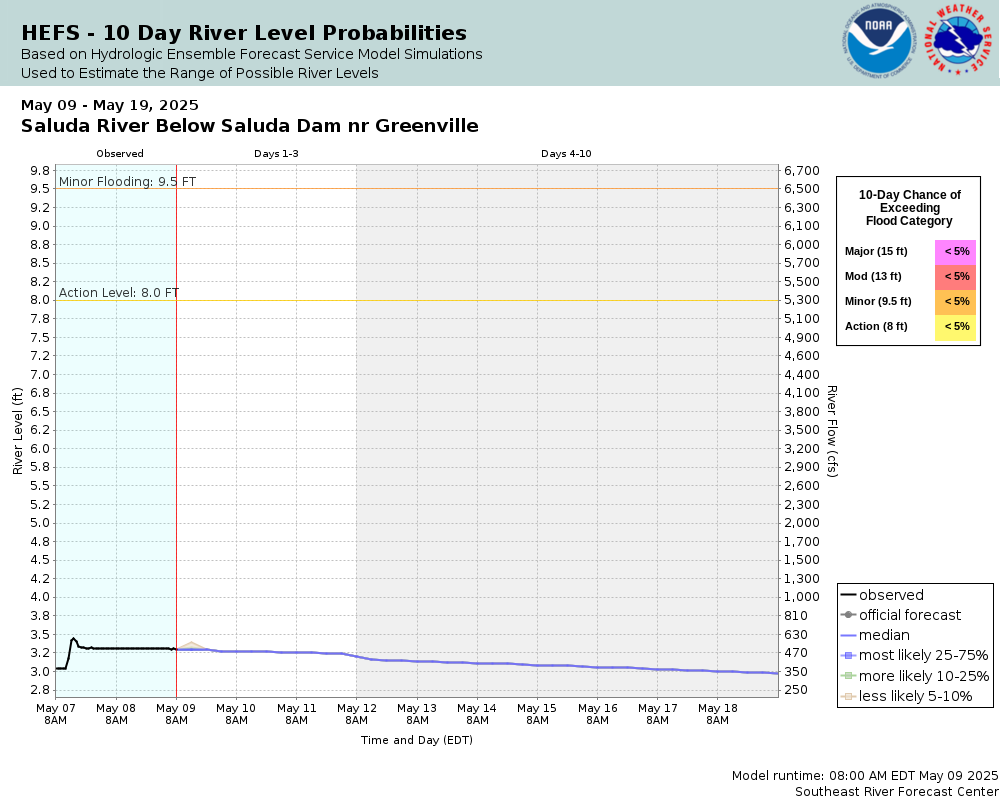
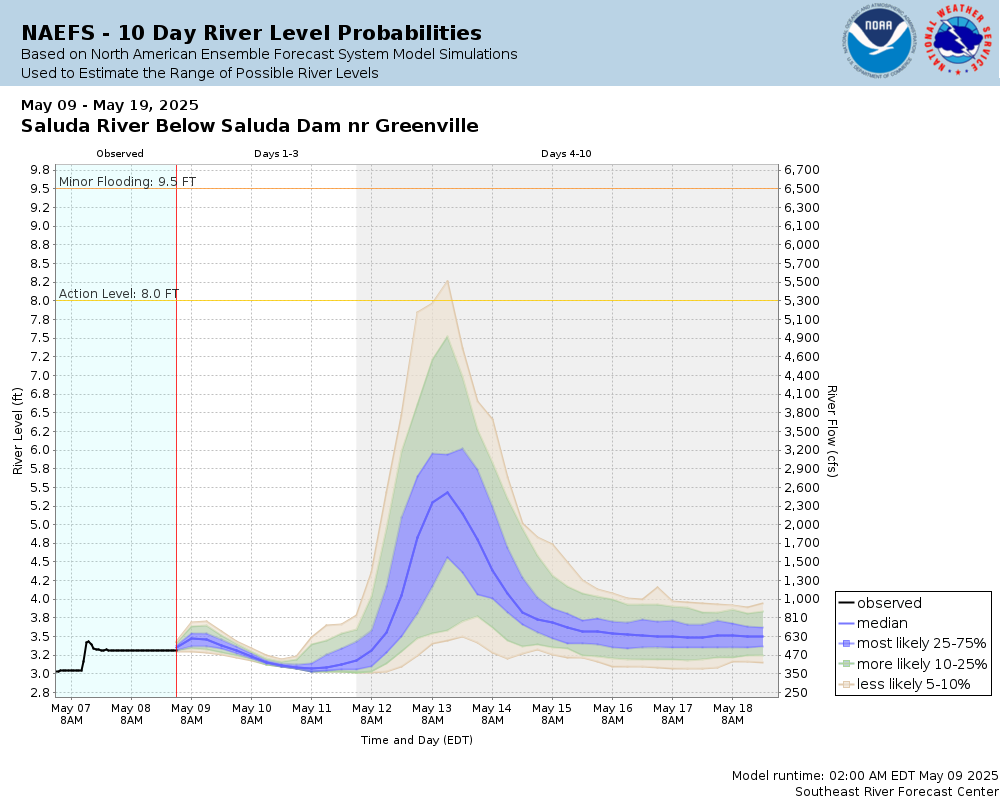
Potential River Level (Ensemble) Hydrographs Used to Estimate the Chance of Flooding and the Range of Possible River Levels Over the Next 10 Days |
||
| Hydrologic Ensemble Forecast Service (HEFS) | North American Ensemble Forecast System (NAEFS) | Global Ensemble Forecast System (GEFS) |
 |
 |
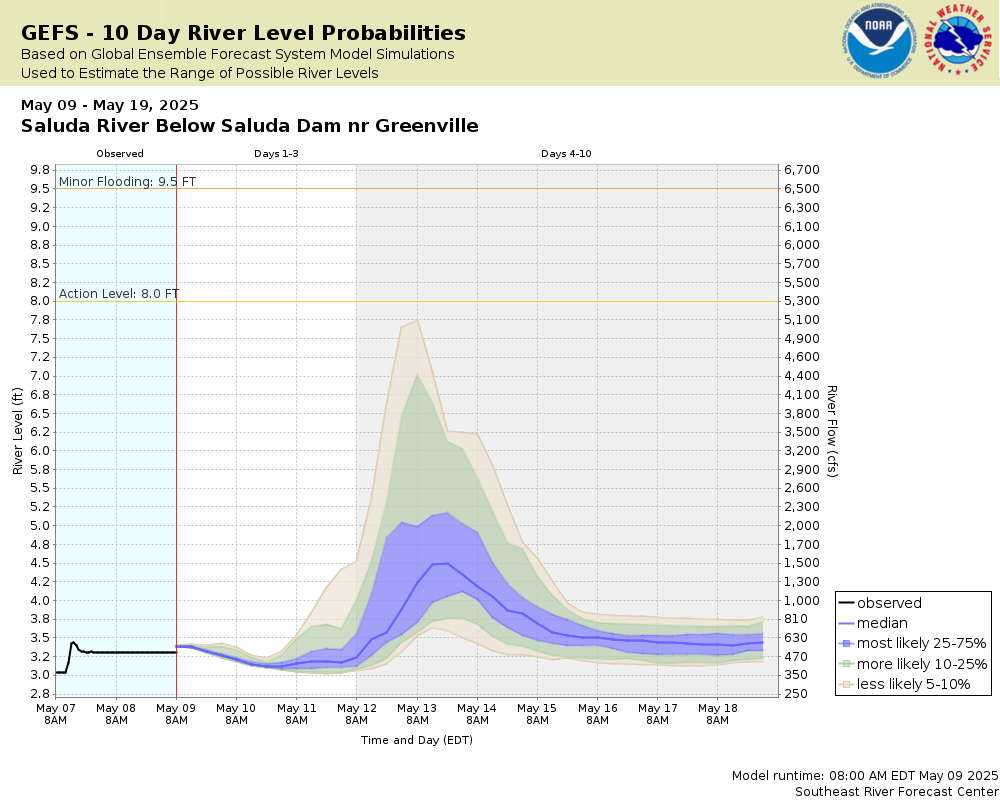 |
Note: The hydrograph at the top of the page is the official NWS forecast for this location based on 48 hours of forecasted rainfall. The ensemble hydrographs shown here are used to assess the range of possible river levels and likelihood of river flooding over the next 10 days using dozens of model-derived, 10-day rainfall forecasts.
See the Product Description Document link for more information on the Meteorological Model-based Ensemble Forecasting System (MMEFS) which produces the ensemble hydrographs above.
Clicking on each ensemble hydrograph enlarges the graph and takes you to the MMEFS website for additional guidance.
Collaborative Agencies
The National Weather Service prepares its forecasts and other services in collaboration with agencies like the US Geological Survey, US Bureau of Reclamation, US Army Corps of Engineers, Natural Resource Conservation Service, National Park Service, ALERT Users Group, Bureau of Indian Affairs, and many state and local emergency managers across the country. For details, please click here.