Russell Fork River at Haysi
Future / Actual / Minor
OWP 2.0 WWA Modal Title
01/11/2021, 10:04 PM UTC through 01/11/2021, 10:04 PM UTC
Sender
Sent
- Upstream gauge unavailableWarning: no valid ratings curve available. Transformations to and from FEET/CFS/KCFS will not happen.
Traces and Thresholds Click to turn on/off display
Observed (OBS) 06/17/2025 10:45 AM EDTOfficial Forecast (FCST) 06/17/2025 10:34 AM EDTRecord: 28.2 ftCATEGORY STAGE 
Major Flooding 24 ft Moderate Flooding 20 ft Minor Flooding 16 ft Action 15 ft Reliability of the Forecast:
NOTE: Forecasts are issued routinely year-round.
River Forecasts typically include ONLY 2 days of future rain from forecast issuance time (lower right of graph). Occasionally 3 days of future rain included.
National Water Model Hydrograph
Official NWS streamflow forecasts are produced by NWS hydrologic forecasters for river gauge locations using hydrologic models which are calibrated to that location. This process considers additional guidance and information, including local expertise and experience, to produce the best forecast possible. The NWM output provides supplemental guidance to NWS forecasters and should not be considered an official NWS river forecast.
Flood Impacts
- 29 - Homes along lower J and M Belcher Drive flood due to backwater into the McClure River.
- 28 - Most of the town is inundated with water.
- 26 - Sections of Clinchfield Railroad tracks northwest of town flood.
- 24 - The water treatment plant floods.
- 23 - Main Street and lower Bartley Street flood.
- 22 - Row of homes on Splashdam Road, just above the water treatment plant, flood.
- 21.5 - The town hall and most businesses on landward side of Main Street flood.
- 20.5 - Businesses on the river side of Main Street located between the Bridge Street bridge and Big Ridge Road bridge flood.
- 20 - Row of homes on Splashdam Road, just below the water treatment plant, flood.
- 16 - Low spots on Splashdam Road and the lower portion of Winding Road near the river flood.
Gauge Info
| Coordinates | 37.2071, -82.2957 |
| RFC | OHRFC |
| State | VA |
| WFO | RLX |
| County | Dickenson |
| Data Provider(s) | |
| US Geological Survey | USGS--Water Resources of the United States |
| USGS | 03208500 |
Gauge Location
Recent Crests
| 1. | 21.04 ft | on 02-16-2025 | (P) |
| 2. | 18.19 ft | on 02-06-2020 | |
| 3. | 18.00 ft | on 02-11-2018 | |
| 4. | 17.06 ft | on 04-23-2017 | |
| 5. | 18.91 ft | on 03-05-2015 |
Recent Crests
| 1. | 21.04 ft | on 02-16-2025 | (P) |
| 2. | 18.19 ft | on 02-06-2020 | |
| 3. | 18.00 ft | on 02-11-2018 | |
| 4. | 17.06 ft | on 04-23-2017 | |
| 5. | 18.91 ft | on 03-05-2015 | |
| 6. | 15.18 ft | on 04-15-2007 | |
| 7. | 18.89 ft | on 02-16-2003 | |
| 8. | 17.99 ft | on 03-18-2002 | |
| 9. | 15.75 ft | on 03-15-2002 | |
| 10. | 17.21 ft | on 04-17-1998 | |
| 11. | 22.08 ft | on 03-07-1984 | |
| 12. | 16.44 ft | on 11-06-1978 | |
| 13. | 19.12 ft | on 01-26-1978 | |
| 14. | 28.24 ft | on 04-04-1977 | |
| 15. | 18.03 ft | on 03-30-1975 | |
| 16. | 17.27 ft | on 03-16-1973 | |
| 17. | 15.71 ft | on 04-28-1970 | |
| 18. | 20.34 ft | on 03-07-1967 | |
| 19. | 21.10 ft | on 03-12-1963 | |
| 20. | 14.88 ft | on 07-31-1961 | |
| 21. | 14.97 ft | on 05-06-1958 | 1 |
| 22. | 23.17 ft | on 01-29-1957 | 1 |
| 23. | 14.32 ft | on 04-15-1956 | 1 |
| 24. | 14.63 ft | on 03-06-1955 | 1 |
| 25. | 13.10 ft | on 01-07-1946 | 1 |
| 26. | 15.46 ft | on 02-17-1944 | 1 |
| 27. | 16.95 ft | on 02-03-1939 | 1 |
| 28. | 13.00 ft | on 02-09-1937 | 1 |
| 29. | 13.04 ft | on 01-30-1932 | 1 |
| 30. | 18.50 ft | on 03-23-1929 | 1 |
| 31. | 12.50 ft | on 12-21-1926 | 1 |
Historic Crests
| 1. | 28.24 ft | on 04-04-1977 | |
| 2. | 23.17 ft | on 01-29-1957 | 1 |
| 3. | 22.08 ft | on 03-07-1984 | |
| 4. | 21.10 ft | on 03-12-1963 | |
| 5. | 21.04 ft | on 02-16-2025 | (P) |
| 6. | 20.34 ft | on 03-07-1967 | |
| 7. | 19.12 ft | on 01-26-1978 | |
| 8. | 18.91 ft | on 03-05-2015 | |
| 9. | 18.89 ft | on 02-16-2003 | |
| 10. | 18.50 ft | on 03-23-1929 | 1 |
| 11. | 18.19 ft | on 02-06-2020 | |
| 12. | 18.03 ft | on 03-30-1975 | |
| 13. | 18.00 ft | on 02-11-2018 | |
| 14. | 17.99 ft | on 03-18-2002 | |
| 15. | 17.27 ft | on 03-16-1973 | |
| 16. | 17.21 ft | on 04-17-1998 | |
| 17. | 17.06 ft | on 04-23-2017 | |
| 18. | 16.95 ft | on 02-03-1939 | 1 |
| 19. | 16.44 ft | on 11-06-1978 | |
| 20. | 15.75 ft | on 03-15-2002 | |
| 21. | 15.71 ft | on 04-28-1970 | |
| 22. | 15.46 ft | on 02-17-1944 | 1 |
| 23. | 15.18 ft | on 04-15-2007 | |
| 24. | 14.97 ft | on 05-06-1958 | 1 |
| 25. | 14.88 ft | on 07-31-1961 | |
| 26. | 14.63 ft | on 03-06-1955 | 1 |
| 27. | 14.32 ft | on 04-15-1956 | 1 |
| 28. | 13.10 ft | on 01-07-1946 | 1 |
| 29. | 13.04 ft | on 01-30-1932 | 1 |
| 30. | 13.00 ft | on 02-09-1937 | 1 |
| 31. | 12.50 ft | on 12-21-1926 | 1 |
Low Water Records
| 1. | 0.77 ft | on 10-02-1985 |
| 2. | 1.15 ft | on 12-20-1939 |
| 3. | 1.38 ft | on 09-17-1964 |
| 4. | 1.49 ft | on 09-28-1963 |
| 5. | 1.50 ft | on 09-02-1962 |
Low Water Records
| 1. | 0.77 ft | on 10-02-1985 |
| 2. | 1.15 ft | on 12-20-1939 |
| 3. | 1.38 ft | on 09-17-1964 |
| 4. | 1.49 ft | on 09-28-1963 |
| 5. | 1.50 ft | on 09-02-1962 |
| 6. | 1.51 ft | on 10-20-1966 |
| 7. | 1.53 ft | on 08-17-1965 |
| 8. | 1.57 ft | on 12-06-1970 |
| 9. | 1.58 ft | on 09-30-1969 |
| 10. | 1.59 ft | on 09-27-1967 |
| 11. | 1.61 ft | on 10-17-1968 |
Vertical Datum Table
| type | NAVD88 |
|---|---|
| major Flooding | 1260.70 ft |
| moderate Flooding | 1256.70 ft |
| minor Flooding | 1252.70 ft |
| action | 1251.70 ft |
| Latest Value | 1240.66 ft |
| Gauge Zero | 1236.70 ft |


Unique Local Info
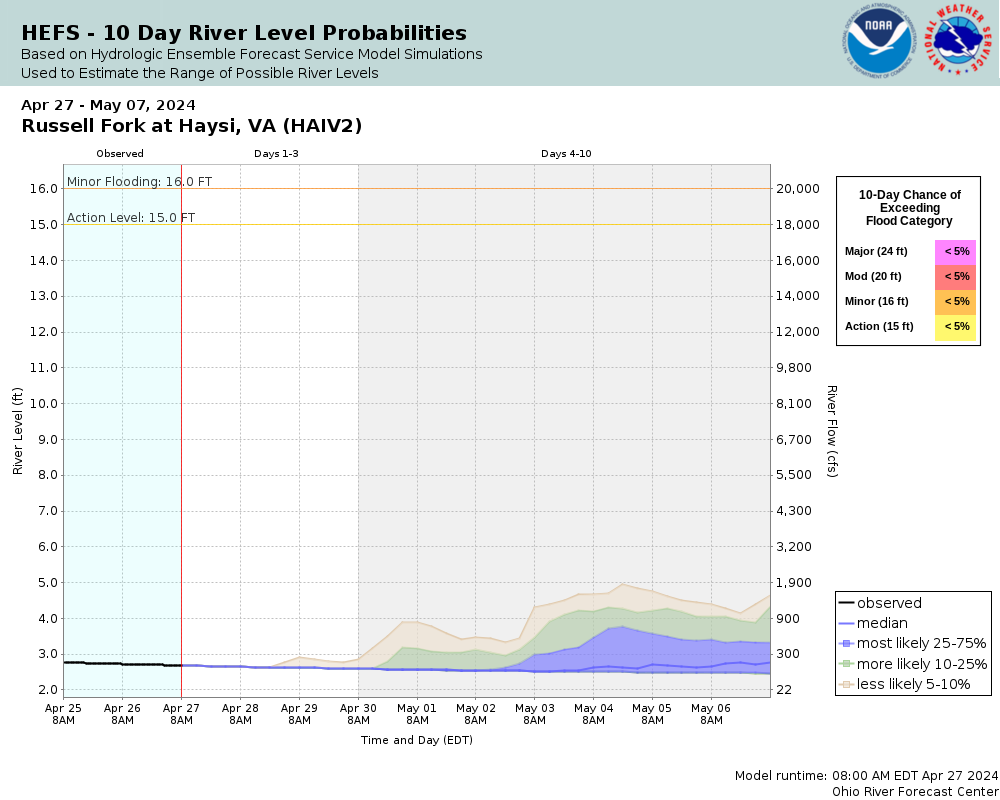
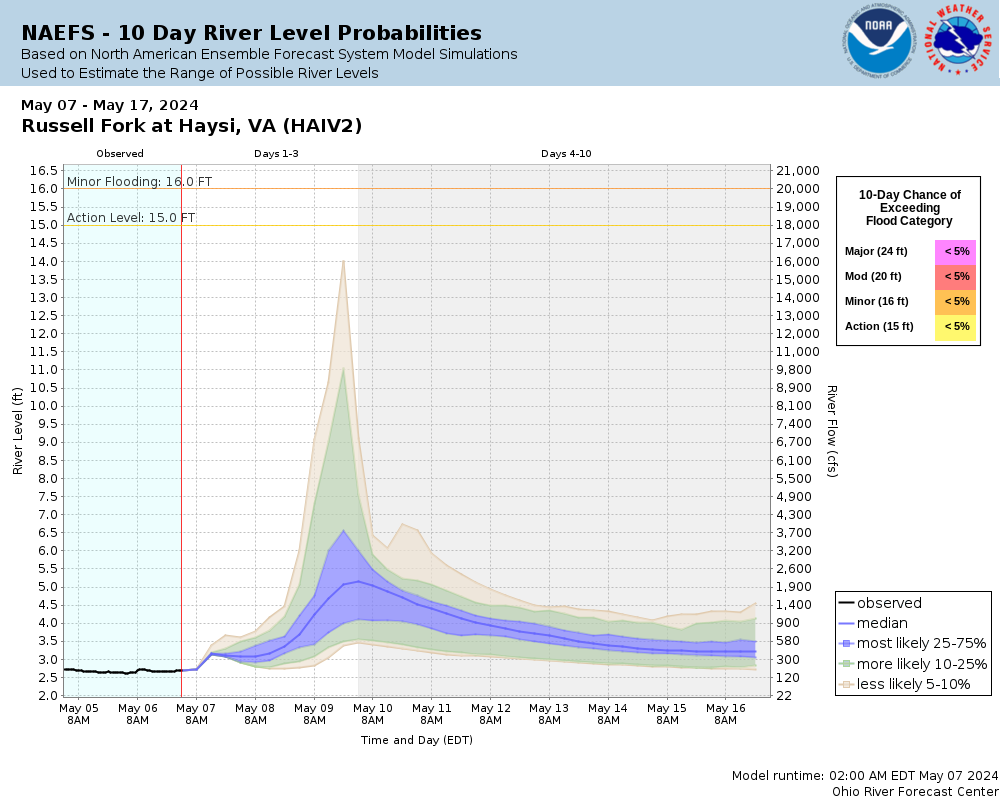
| Potential River Levels Used to Estimate the Chance of Flooding and the Range of Possible River Levels |
||
| 10 day (HEFS) | 10 Day (NAEFS) | River Forecast vs. River Potential |
 |
 |
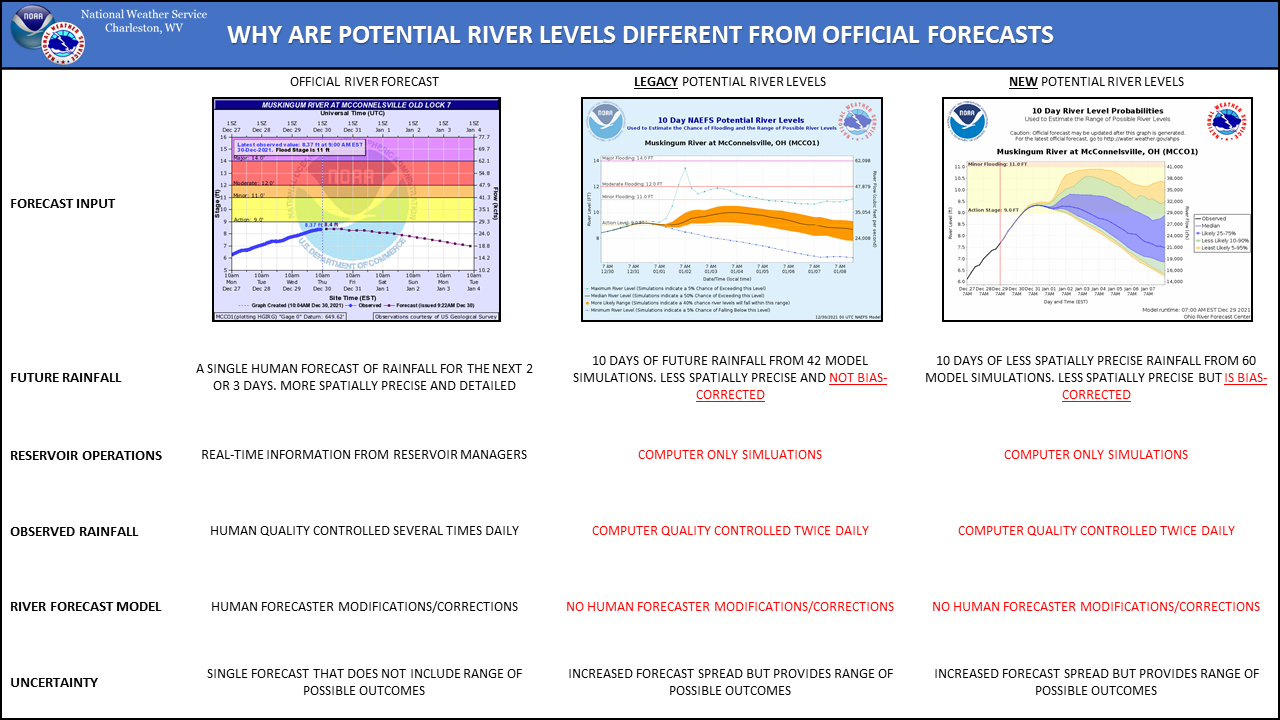 |
Note: Use the official hydrograph at the top of this web page for river levels within the next 72 hours.
See the Product Description Document link for more details on the interpretation of the 10 day graphics.
Collaborative Agencies
The National Weather Service prepares its forecasts and other services in collaboration with agencies like the US Geological Survey, US Bureau of Reclamation, US Army Corps of Engineers, Natural Resource Conservation Service, National Park Service, ALERT Users Group, Bureau of Indian Affairs, and many state and local emergency managers across the country. For details, please click here.
Resources
Hydrologic Resource Links
- River Forecast Centers
- Text Products
- Past Precipitation
- Forecast Precipitation
- Area River Monitor
- Ensemble River Forecasts
- Ensemble River Forecasts Dashboard
- Ohio Basin Water Resources Outlook
- USGS Water Watch for West Virginia
- USGS Water Watch for Ohio
- USGS Water Watch for Kentucky
- USGS Water Watch for Virginia
- Inundation Mapping Locations
- Hydrometeorlogical Design Studies Center
- USACE Huntington District Water Information
- USACE Pittsburgh District Water Information
Additional Resource Links
- NWS Precipitation and River Forecasting
- Area Hydrographs
- Snow Information
- Rainfall Monitor
- Flood Safety
- U.S. Drought Monitor Conditions For West Virginia
- U.S. Drought Monitor Conditions For Ohio
- U.S. Drought Monitor Conditions For Kentucky
- U.S. Drought Monitor Conditions For Virginia
- NOAA Climate Services