Great Miami River at Hamilton
Future / Actual / Minor
OWP 2.0 WWA Modal Title
01/11/2021, 10:04 PM UTC through 01/11/2021, 10:04 PM UTC
Sender
Sent
- Warning: no valid ratings curve available. Transformations to and from FEET/CFS/KCFS will not happen.
Traces and Thresholds Click to turn on/off display
Observed (OBS) 06/20/2025 11:00 PM EDTOfficial Forecast (FCST) 06/20/2025 9:23 AM EDTLow Threshold: 61 ftCATEGORY STAGE 
Major Flooding 89.5 ft Moderate Flooding 82 ft Minor Flooding 75 ft Action 73 ft Reliability of the Forecast:
NOTE: Forecasts are issued routinely year-round.
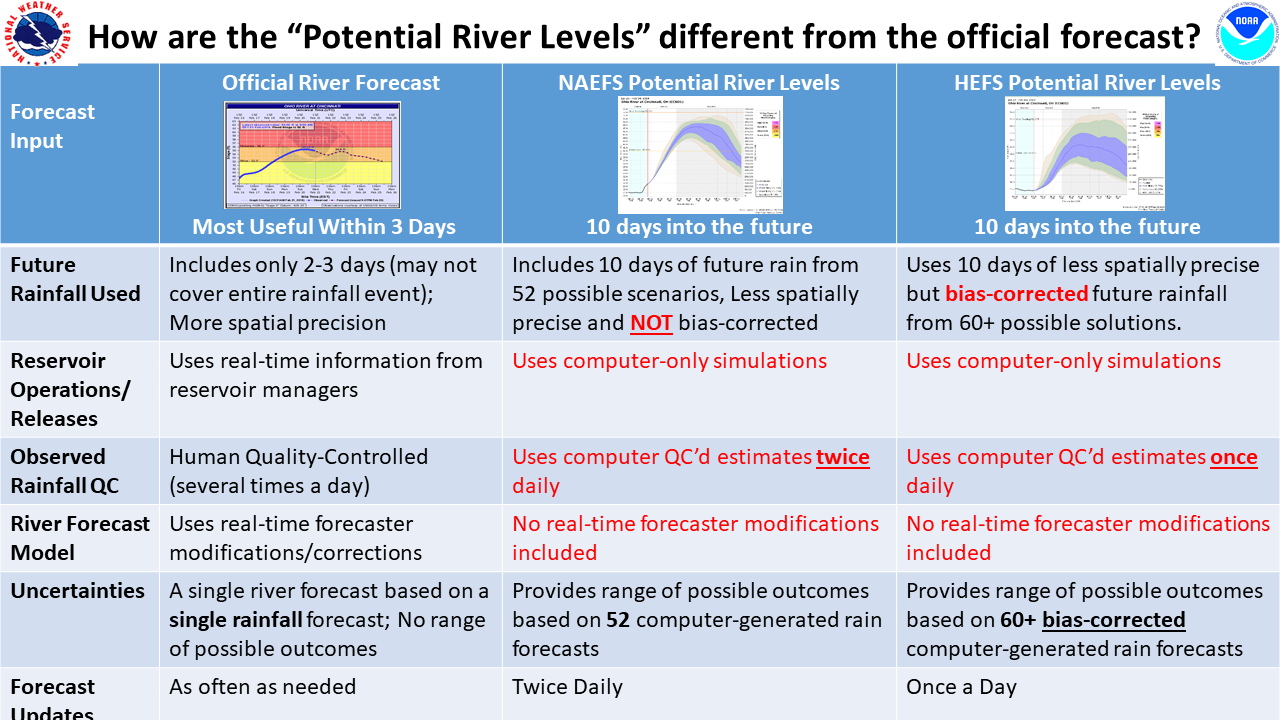
River Forecasts typically include ONLY 2 days of future rain from forecast issuance time (lower right of graph). Occasionally 3 days of future rain included.
National Water Model Hydrograph
Official NWS streamflow forecasts are produced by NWS hydrologic forecasters for river gauge locations using hydrologic models which are calibrated to that location. This process considers additional guidance and information, including local expertise and experience, to produce the best forecast possible. The NWM output provides supplemental guidance to NWS forecasters and should not be considered an official NWS river forecast.
Flood Impacts
- 90 - Water would overtop levees on the south side of Hamilton. Water levels exceeding 90 feet would top all levees protecting the business district resulting in major flooding near the river channel through the entire city. Major flooding occurs, especially near New Miami and Ross, where homes and businesses along the river are suffering major inundation.
- 89 - This elevation is at the top of some levees protecting mainly the southern areas of Hamilton. In addition to major inundation of communities such as New Miami and near Ross, river stages above this level would inundate some areas of Hamilton south of Pershing Avenue along and near Neilan Boulevard. Widespread inundation occurs near Joyce Park and Joe Nuxhall Lane.
- 84 - Flooding worsens in lowland areas in southern Butler County between State Route 128 and the Great Miami River. Flooding also worsens along the river near Ross. The City of Hamilton itself is protected from river flooding up to 89 feet for locations in the southern part of the city, with most of the city protected at stages up to 90 feet.
Gauge Location
Recent Crests
| 1. | 75.15 ft | on 03-19-2008 |
| 2. | 72.87 ft | on 01-14-2005 |
| 3. | 75.57 ft | on 01-06-2005 |
| 4. | 75.84 ft | on 01-05-2004 |
| 5. | 74.26 ft | on 04-29-1996 |
Recent Crests
| 1. | 75.15 ft | on 03-19-2008 | |
| 2. | 72.87 ft | on 01-14-2005 | |
| 3. | 75.57 ft | on 01-06-2005 | |
| 4. | 75.84 ft | on 01-05-2004 | |
| 5. | 74.26 ft | on 04-29-1996 | |
| 6. | 72.10 ft | on 08-10-1995 | |
| 7. | 73.75 ft | on 01-31-1982 | |
| 8. | 75.41 ft | on 05-24-1968 | |
| 9. | 74.96 ft | on 03-05-1963 | |
| 10. | 73.42 ft | on 05-08-1961 | |
| 11. | 79.20 ft | on 01-21-1959 | 1 |
| 12. | 75.95 ft | on 01-27-1952 | |
| 13. | 72.65 ft | on 01-24-1949 | |
| 14. | 74.50 ft | on 01-06-1949 | |
| 15. | 74.50 ft | on 01-06-1945 | |
| 16. | 76.60 ft | on 03-19-1943 | |
| 17. | 76.33 ft | on 01-22-1937 | |
| 18. | 76.50 ft | on 02-26-1929 |
Historic Crests
| 1. | 79.20 ft | on 01-21-1959 | 1 |
| 2. | 76.60 ft | on 03-19-1943 | |
| 3. | 76.50 ft | on 02-26-1929 | |
| 4. | 76.33 ft | on 01-22-1937 | |
| 5. | 75.95 ft | on 01-27-1952 |
Historic Crests
| 1. | 79.20 ft | on 01-21-1959 | 1 |
| 2. | 76.60 ft | on 03-19-1943 | |
| 3. | 76.50 ft | on 02-26-1929 | |
| 4. | 76.33 ft | on 01-22-1937 | |
| 5. | 75.95 ft | on 01-27-1952 | |
| 6. | 75.84 ft | on 01-05-2004 | |
| 7. | 75.57 ft | on 01-06-2005 | |
| 8. | 75.41 ft | on 05-24-1968 | |
| 9. | 75.15 ft | on 03-19-2008 | |
| 10. | 74.96 ft | on 03-05-1963 | |
| 11. | 74.50 ft | on 01-06-1949 | |
| 12. | 74.50 ft | on 01-06-1945 | |
| 13. | 74.26 ft | on 04-29-1996 | |
| 14. | 73.75 ft | on 01-31-1982 | |
| 15. | 73.42 ft | on 05-08-1961 | |
| 16. | 72.87 ft | on 01-14-2005 | |
| 17. | 72.65 ft | on 01-24-1949 | |
| 18. | 72.10 ft | on 08-10-1995 |
Vertical Datum Table
| type | NAVD88 |
|---|---|
| major Flooding | 588.69 ft |
| moderate Flooding | 581.19 ft |
| minor Flooding | 574.19 ft |
| action | 572.19 ft |
| Latest Value | 563.95 ft |
| Gauge Zero | 499.19 ft |


Unique Local Info
|
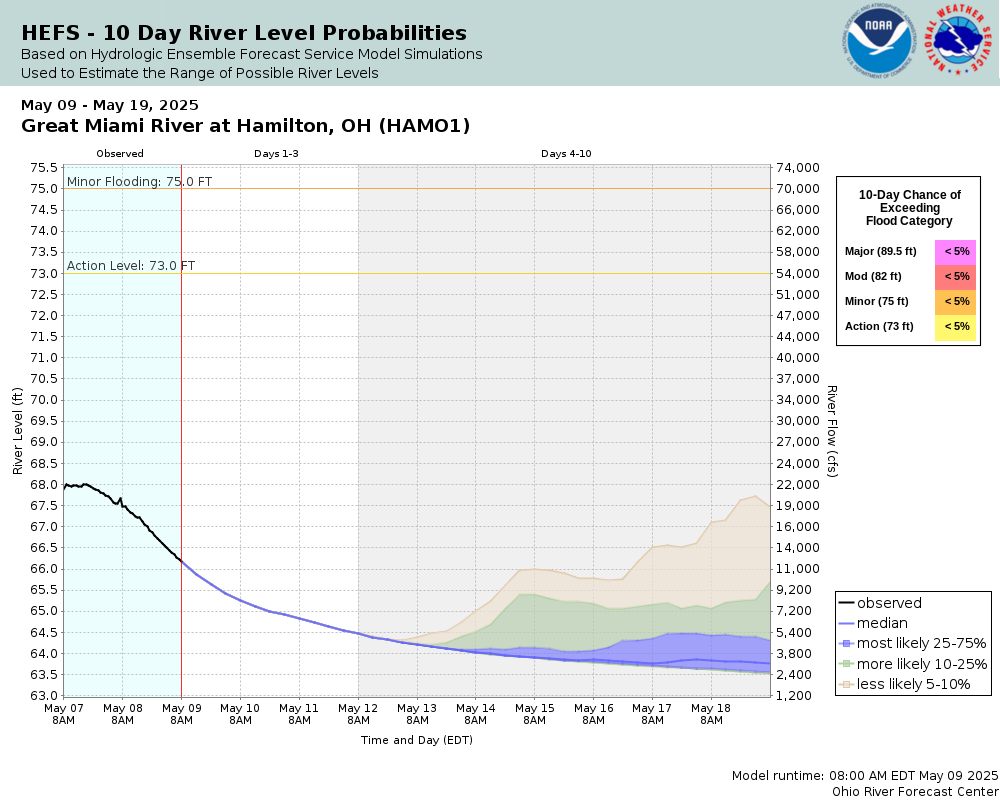
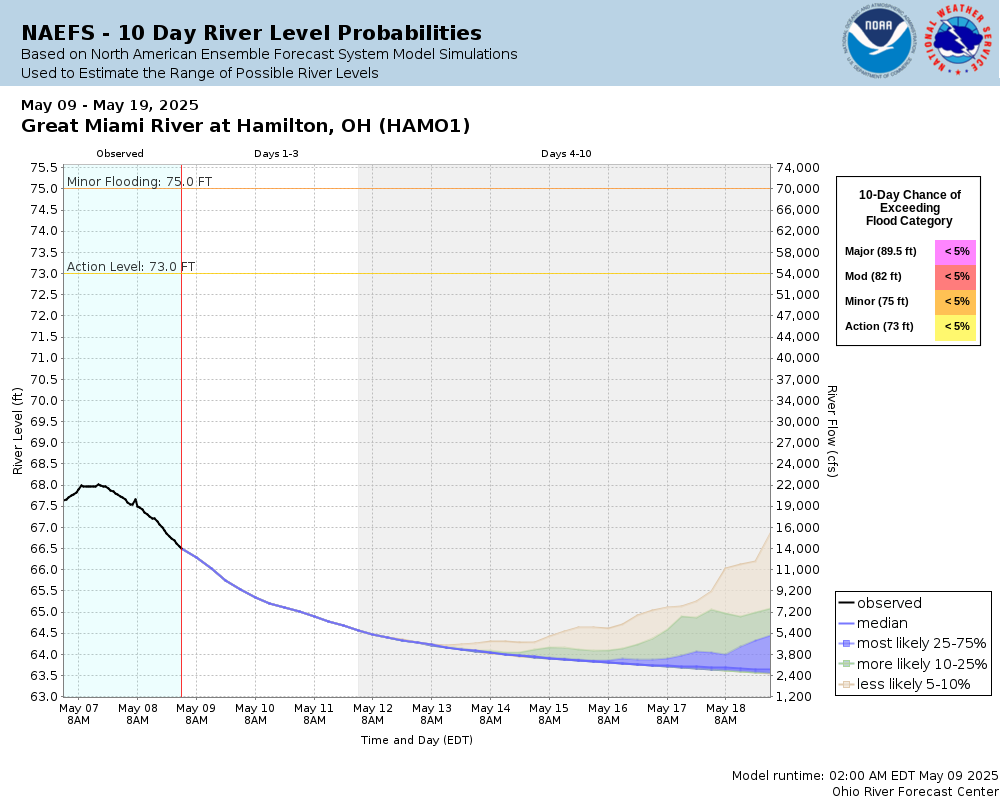
Potential River Levels Used to Estimate the Chance of Flooding and the Range of Possible River Levels |
||
| 10 Day (HEFS) | 10 Day (NAEFS) | River Forecast VS. River Potential |
 |
 |
 |
Note: Use the official hydrograph at the top of this web page for river levels within the next 72 hours.
See the Product Description Document link for more details on the interpretation of the 10 day graphics.
Click individual graphics to enlarge.
Collaborative Agencies
The National Weather Service prepares its forecasts and other services in collaboration with agencies like the US Geological Survey, US Bureau of Reclamation, US Army Corps of Engineers, Natural Resource Conservation Service, National Park Service, ALERT Users Group, Bureau of Indian Affairs, and many state and local emergency managers across the country. For details, please click here.
Resources
Hydrologic Resource Links
- River Forecast Centers
- NEW!! Mobile friendly river forecasts for the entire Ohio River
- Text Products
- Past Precipitation - OHRFC
- Forecast Precipitation included in river forecasts
- Significant/Moderate Flood Outlook (next 5 days)
- Ohio Basin Water Resources Outlook
- Inundation Mapping Locations
- Archived Radar/Raingage Precipitation