Chicopee River at Indian Orchard
Future / Actual / Minor
OWP 2.0 WWA Modal Title
01/11/2021, 10:04 PM UTC through 01/11/2021, 10:04 PM UTC
Sender
Sent
- Upstream gauge unavailableDownstream gauge unavailableWarning: no valid ratings curve available. Transformations to and from FEET/CFS/KCFS will not happen.
Traces and Thresholds Click to turn on/off display
Observed (OBS) 06/10/2025 2:00 AM EDTOfficial Forecast (FCST) 06/09/2025 10:47 AM EDTRecord: 23.4 ftCATEGORY STAGE 
Major Flooding 18 ft Moderate Flooding 16 ft Minor Flooding 12 ft Action 11 ft Reliability of the Forecast:
NOTE: Forecasts are issued routinely year-round.
National Water Model Hydrograph
Official NWS streamflow forecasts are produced by NWS hydrologic forecasters for river gauge locations using hydrologic models which are calibrated to that location. This process considers additional guidance and information, including local expertise and experience, to produce the best forecast possible. The NWM output provides supplemental guidance to NWS forecasters and should not be considered an official NWS river forecast.
Flood Impacts
- 20 - This is a life threatening flood situation. People along the Chicopee River should seek a safe shelter, inland of the river. Know the alternate routes of travel to avoid driving into flooded areas. Act quickly and follow the directions of your local emergency management officals.
- 16 - Significant flooding will occur along the Chicopee River. If you are in a flood prone location, act immediately to protect life and property. Follow the directions of your local emergency management officials. If you are asked to evacuate, do so immediately.
- 12 - Minor lowland flooding is likely. Some roadways along the river may become impassable. Do not venture into these areas. Be especially careful near flooded roadways. Never try to cross a flooded road, the road could be damaged or washed out.
Gauge Info
| Coordinates | 42.1606, -72.5140 |
| RFC | NERFC |
| State | MA |
| WFO | BOX |
| County | Hampden |
| Data Provider(s) | |
| US Geological Survey | USGS--Water Resources of the United States |
| USGS | 01177000 |
Gauge Location
Recent Crests
| 1. | 12.92 ft | on 10-15-2005 |
| 2. | 10.74 ft | on 04-17-1996 |
| 3. | 7.66 ft | on 03-09-1995 |
| 4. | 13.96 ft | on 05-31-1984 |
| 5. | 12.20 ft | on 03-07-1979 |
Recent Crests
| 1. | 12.92 ft | on 10-15-2005 | |
| 2. | 10.74 ft | on 04-17-1996 | |
| 3. | 7.66 ft | on 03-09-1995 | |
| 4. | 13.96 ft | on 05-31-1984 | |
| 5. | 12.20 ft | on 03-07-1979 | |
| 6. | 22.14 ft | on 08-19-1955 | |
| 7. | 23.43 ft | on 09-21-1938 | 1 |
| 8. | 16.20 ft | on 03-19-1936 | 1 |
Historic Crests
| 1. | 23.43 ft | on 09-21-1938 | 1 |
| 2. | 22.14 ft | on 08-19-1955 | |
| 3. | 16.20 ft | on 03-19-1936 | 1 |
| 4. | 13.96 ft | on 05-31-1984 | |
| 5. | 12.92 ft | on 10-15-2005 |
Historic Crests
| 1. | 23.43 ft | on 09-21-1938 | 1 |
| 2. | 22.14 ft | on 08-19-1955 | |
| 3. | 16.20 ft | on 03-19-1936 | 1 |
| 4. | 13.96 ft | on 05-31-1984 | |
| 5. | 12.92 ft | on 10-15-2005 | |
| 6. | 12.20 ft | on 03-07-1979 | |
| 7. | 10.74 ft | on 04-17-1996 | |
| 8. | 7.66 ft | on 03-09-1995 |
Vertical Datum Table
| type | NAVD88 |
|---|---|
| major Flooding | 142.31 ft |
| moderate Flooding | 140.31 ft |
| minor Flooding | 136.31 ft |
| action | 135.31 ft |
| Latest Value | 130.11 ft |
| Gauge Zero | 124.31 ft |
Gauge Photos
No Images Found


Unique Local Info
|
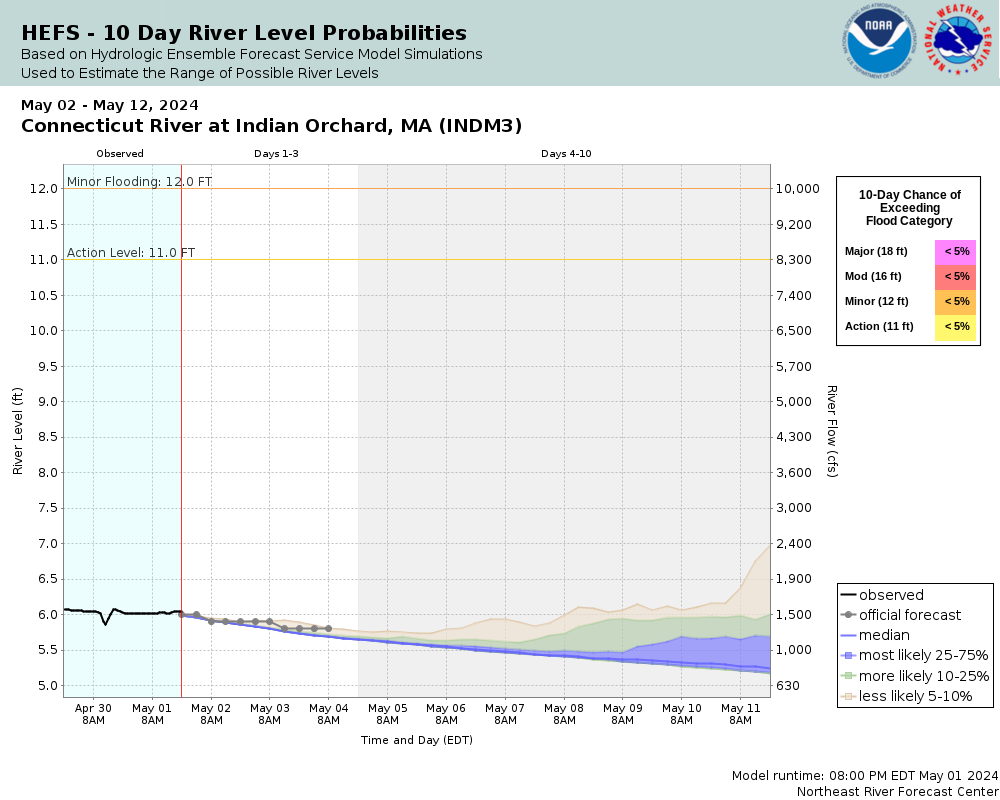
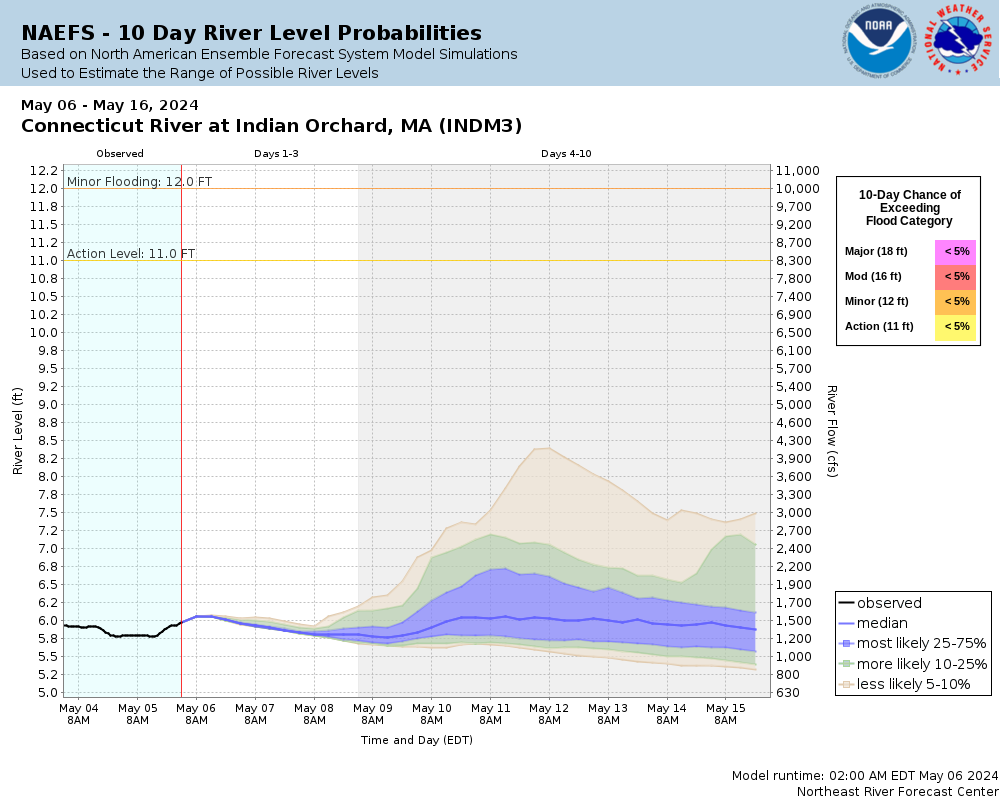
Potential River Levels Used to Estimate the Chance of Flooding and the Range of Possible River Levels |
||
| 10 Day (HEFS) | 10 Day (NAEFS) | 10 Day (GEFS) |
 |
 |
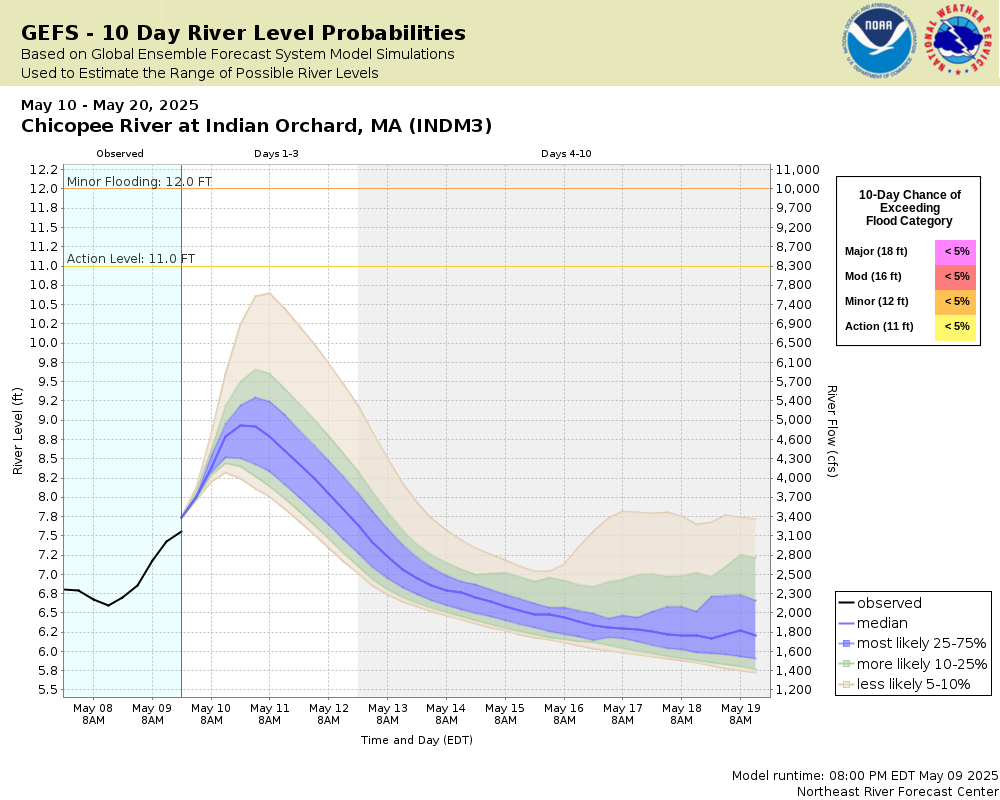 |
Note: Use the official hydrograph at the top of this web page for river levels within the next 72 hours.
Click individual graphics to enlarge.
Collaborative Agencies
The National Weather Service prepares its forecasts and other services in collaboration with agencies like the US Geological Survey, US Bureau of Reclamation, US Army Corps of Engineers, Natural Resource Conservation Service, National Park Service, ALERT Users Group, Bureau of Indian Affairs, and many state and local emergency managers across the country. For details, please click here.