James River (VA) at Jamestown/Scotland Ferry (IN MLLW)
Future / Actual / Minor
OWP 2.0 WWA Modal Title
01/11/2021, 10:04 PM UTC through 01/11/2021, 10:04 PM UTC
Sender
Sent
- Upstream gauge unavailableDownstream gauge unavailableWarning: no valid ratings curve available. Transformations to and from FEET/CFS/KCFS will not happen.No secondary data available. Transformations for Flow data and a secondary Y axis cannot be made at this time.
Traces and Thresholds Click to turn on/off display
Observed (OBS) 06/09/2025 5:00 AM EDTOfficial Forecast (FCST) 06/09/2025 1:36 AM EDTLow Threshold: -1 ftCATEGORY STAGE 
Major Flooding 5 ft Moderate Flooding 4.5 ft Minor Flooding 4 ft Action 3.5 ft Reliability of the Forecast:
NOTE: Forecasts are issued routinely year-round.
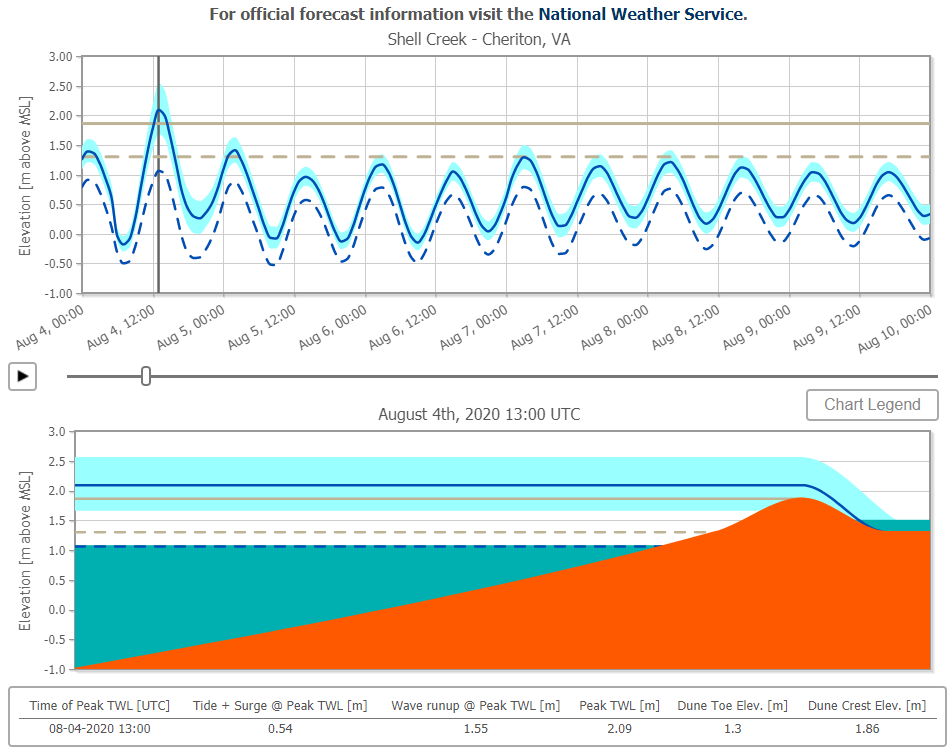
Tide Forecasts are a total water level forecast referenced to mean lower low water. Please refer to Coastal Flood Advisories and Warnings for official water level forecasts during periods of coastal flooding. During tropical cyclones, please refer here for additional storm surge information.
Please click here for Coastal Flooding Thresholds definitions.
National Water Model Hydrograph
Official NWS streamflow forecasts are produced by NWS hydrologic forecasters for river gauge locations using hydrologic models which are calibrated to that location. This process considers additional guidance and information, including local expertise and experience, to produce the best forecast possible. The NWM output provides supplemental guidance to NWS forecasters and should not be considered an official NWS river forecast.
Flood Impacts
- 5 - Severe flooding will cause extensive inundation and flooding of numerous roads and buildings resulting in a significant threat to property and life. Water will be 2 to 3 feet or more above ground level in some areas. Severe flooding will extend inland from the waterfront and shoreline flooding homes, businesses and isolating some neighborhoods. Numerous roads will be impassable under several feet of water and cars submerged. Some areas will need to be evacuated.
- 4.5 - Widespread flooding of vulnerable areas will result in an elevated threat of property damage to homes and businesses near the waterfront and shoreline. Water will be 1 to 2 feet above ground level in some areas resulting in a sufficient depth to close numerous roads and threaten homes and businesses. Flooding will extend inland from the waterfront along tidal rivers and bays resulting in some road closures and flooding of vehicles.
- 4 - Shallow flooding is expected in the most vulnerable locations near the waterfront and shoreline resulting in a low threat of property damage. Expect up to one foot of water above ground level in low lying, vulnerable areas. Some roads and low lying property including parking lots, parks and lawns near the waterfront will experience shallow flooding.
Gauge Info
| Coordinates | 37.2201, -76.7915 |
| RFC | MARFC |
| State | VA |
| WFO | AKQ |
| County | James City |
| Data Provider(s) | |
| US Geological Survey | USGS--Water Resources of the United States |
| USGS | 02042770 |
Gauge Location
Recent Crests
| 1. | 4.59 ft | on 11-15-2024 | (P) |
| 2. | 4.60 ft | on 10-01-2024 | (P) |
| 3. | 4.11 ft | on 09-28-2024 | (P) |
| 4. | 4.45 ft | on 09-22-2024 | (P) |
| 5. | 4.25 ft | on 09-17-2024 | (P) |
Recent Crests
| 1. | 4.59 ft | on 11-15-2024 | (P) |
| 2. | 4.60 ft | on 10-01-2024 | (P) |
| 3. | 4.11 ft | on 09-28-2024 | (P) |
| 4. | 4.45 ft | on 09-22-2024 | (P) |
| 5. | 4.25 ft | on 09-17-2024 | (P) |
| 6. | 4.37 ft | on 05-11-2024 | (P) |
| 7. | 3.94 ft | on 04-04-2024 | |
| 8. | 4.34 ft | on 03-27-2024 | (P) |
| 9. | 4.06 ft | on 03-09-2024 | (P) |
| 10. | 4.39 ft | on 02-06-2024 | (P) |
| 11. | 4.15 ft | on 01-10-2024 | (P) |
| 12. | 4.06 ft | on 12-18-2023 | (P) |
| 13. | 3.87 ft | on 10-15-2023 | |
| 14. | 4.53 ft | on 09-27-2023 | |
| 15. | 5.23 ft | on 09-23-2023 | |
| 16. | 4.09 ft | on 09-01-2023 | |
| 17. | 4.13 ft | on 08-31-2023 | |
| 18. | 4.65 ft | on 06-21-2023 | |
| 19. | 4.12 ft | on 06-04-2023 | |
| 20. | 5.50 ft | on 10-01-2022 | |
| 21. | 4.23 ft | on 09-09-2022 | |
| 22. | 5.09 ft | on 05-10-2022 | |
| 23. | 4.96 ft | on 01-03-2022 | |
| 24. | 4.27 ft | on 11-07-2021 | |
| 25. | 4.52 ft | on 10-10-2021 | |
| 26. | 4.73 ft | on 05-30-2021 | |
| 27. | 4.08 ft | on 04-13-2021 | |
| 28. | 4.20 ft | on 03-19-2021 | |
| 29. | 4.24 ft | on 11-14-2020 | |
| 30. | 4.21 ft | on 10-31-2020 | |
| 31. | 4.43 ft | on 09-21-2020 | |
| 32. | 4.50 ft | on 08-15-2020 | |
| 33. | 4.39 ft | on 06-16-2020 | |
| 34. | 4.78 ft | on 05-19-2020 | |
| 35. | 4.93 ft | on 04-01-2020 | |
| 36. | 4.58 ft | on 11-17-2019 | |
| 37. | 4.89 ft | on 10-11-2019 | |
| 38. | 4.09 ft | on 09-19-2019 | |
| 39. | 4.63 ft | on 09-06-2019 | |
| 40. | 4.60 ft | on 08-26-2019 | |
| 41. | 4.17 ft | on 05-13-2019 | |
| 42. | 4.56 ft | on 09-10-2018 | |
| 43. | 4.15 ft | on 03-21-2018 | |
| 44. | 4.35 ft | on 03-07-2018 | |
| 45. | 4.07 ft | on 11-09-2017 | |
| 46. | 4.27 ft | on 09-19-2017 | |
| 47. | 4.33 ft | on 08-29-2017 | |
| 48. | 4.08 ft | on 07-30-2017 | |
| 49. | 4.11 ft | on 06-07-2017 | |
| 50. | 4.05 ft | on 05-13-2017 | |
| 51. | 4.07 ft | on 01-24-2017 | |
| 52. | 3.83 ft | on 12-06-2016 | |
| 53. | 4.96 ft | on 10-09-2016 | |
| 54. | 4.52 ft | on 09-29-2016 | |
| 55. | 5.40 ft | on 09-03-2016 | |
| 56. | 4.66 ft | on 05-06-2016 | |
| 57. | 4.28 ft | on 02-09-2016 | |
| 58. | 6.27 ft | on 10-04-2015 |
Historic Crests
| 1. | 6.27 ft | on 10-04-2015 |
| 2. | 5.50 ft | on 10-01-2022 |
| 3. | 5.40 ft | on 09-03-2016 |
| 4. | 5.23 ft | on 09-23-2023 |
| 5. | 5.09 ft | on 05-10-2022 |
Historic Crests
| 1. | 6.27 ft | on 10-04-2015 | |
| 2. | 5.50 ft | on 10-01-2022 | |
| 3. | 5.40 ft | on 09-03-2016 | |
| 4. | 5.23 ft | on 09-23-2023 | |
| 5. | 5.09 ft | on 05-10-2022 | |
| 6. | 4.96 ft | on 10-09-2016 | |
| 7. | 4.96 ft | on 01-03-2022 | |
| 8. | 4.93 ft | on 04-01-2020 | |
| 9. | 4.89 ft | on 10-11-2019 | |
| 10. | 4.78 ft | on 05-19-2020 | |
| 11. | 4.73 ft | on 05-30-2021 | |
| 12. | 4.66 ft | on 05-06-2016 | |
| 13. | 4.65 ft | on 06-21-2023 | |
| 14. | 4.63 ft | on 09-06-2019 | |
| 15. | 4.60 ft | on 08-26-2019 | |
| 16. | 4.60 ft | on 10-01-2024 | (P) |
| 17. | 4.59 ft | on 11-15-2024 | (P) |
| 18. | 4.58 ft | on 11-17-2019 | |
| 19. | 4.56 ft | on 09-10-2018 | |
| 20. | 4.53 ft | on 09-27-2023 | |
| 21. | 4.52 ft | on 09-29-2016 | |
| 22. | 4.52 ft | on 10-10-2021 | |
| 23. | 4.50 ft | on 08-15-2020 | |
| 24. | 4.45 ft | on 09-22-2024 | (P) |
| 25. | 4.43 ft | on 09-21-2020 | |
| 26. | 4.39 ft | on 02-06-2024 | (P) |
| 27. | 4.39 ft | on 06-16-2020 | |
| 28. | 4.37 ft | on 05-11-2024 | (P) |
| 29. | 4.35 ft | on 03-07-2018 | |
| 30. | 4.34 ft | on 03-27-2024 | (P) |
| 31. | 4.33 ft | on 08-29-2017 | |
| 32. | 4.28 ft | on 02-09-2016 | |
| 33. | 4.27 ft | on 11-07-2021 | |
| 34. | 4.27 ft | on 09-19-2017 | |
| 35. | 4.25 ft | on 09-17-2024 | (P) |
| 36. | 4.24 ft | on 11-14-2020 | |
| 37. | 4.23 ft | on 09-09-2022 | |
| 38. | 4.21 ft | on 10-31-2020 | |
| 39. | 4.20 ft | on 03-19-2021 | |
| 40. | 4.17 ft | on 05-13-2019 | |
| 41. | 4.15 ft | on 03-21-2018 | |
| 42. | 4.15 ft | on 01-10-2024 | (P) |
| 43. | 4.13 ft | on 08-31-2023 | |
| 44. | 4.12 ft | on 06-04-2023 | |
| 45. | 4.11 ft | on 06-07-2017 | |
| 46. | 4.11 ft | on 09-28-2024 | (P) |
| 47. | 4.09 ft | on 09-19-2019 | |
| 48. | 4.09 ft | on 09-01-2023 | |
| 49. | 4.08 ft | on 04-13-2021 | |
| 50. | 4.08 ft | on 07-30-2017 | |
| 51. | 4.07 ft | on 11-09-2017 | |
| 52. | 4.07 ft | on 01-24-2017 | |
| 53. | 4.06 ft | on 12-18-2023 | (P) |
| 54. | 4.06 ft | on 03-09-2024 | (P) |
| 55. | 4.05 ft | on 05-13-2017 | |
| 56. | 3.94 ft | on 04-04-2024 | |
| 57. | 3.87 ft | on 10-15-2023 | |
| 58. | 3.83 ft | on 12-06-2016 |
Vertical Datum Table
| type | HAT | MHHW* | MLLW* | NAVD88 |
|---|---|---|---|---|
| major Flooding | 5.00 ft | 2.77 ft | 5.00 ft | 3.77 ft |
| moderate Flooding | 4.50 ft | 2.27 ft | 4.50 ft | 3.27 ft |
| minor Flooding | 4.00 ft | 1.77 ft | 4.00 ft | 2.77 ft |
| action | 3.50 ft | 1.27 ft | 3.50 ft | 2.27 ft |
| Latest Value | 1.53 ft | -0.70 ft | 1.53 ft | 0.30 ft |
| Gauge Zero | 0.00 ft | -2.23 ft | 0.00 ft | -1.23 ft |
Gauge Photos
No Images Found
Probability Information
No Images Available
Unique Local Info
|
|
|
|
|
||||||||
|
Additional Water and Weather Topics affecting Mid-Atlantic coastal regions: |
|||||||||||
Collaborative Agencies
The National Weather Service prepares its forecasts and other services in collaboration with agencies like the US Geological Survey, US Bureau of Reclamation, US Army Corps of Engineers, Natural Resource Conservation Service, National Park Service, ALERT Users Group, Bureau of Indian Affairs, and many state and local emergency managers across the country. For details, please click here.