Great Kills Harbor at Great Kills (IN MLLW)
Future / Actual / Minor
OWP 2.0 WWA Modal Title
01/11/2021, 10:04 PM UTC through 01/11/2021, 10:04 PM UTC
Sender
Sent
- Upstream gauge unavailableDownstream gauge unavailableGauge out of service.
Official
CATEGORY STAGE 
Major Flooding 9.5 ft Moderate Flooding 8.5 ft Minor Flooding 7.5 ft - Gauge out of service.
National Water Model Hydrograph
Official NWS streamflow forecasts are produced by NWS hydrologic forecasters for river gauge locations using hydrologic models which are calibrated to that location. This process considers additional guidance and information, including local expertise and experience, to produce the best forecast possible. The NWM output provides supplemental guidance to NWS forecasters and should not be considered an official NWS river forecast.
Flood Impacts
- 14.6 - Five to eight feet of inundation occurs on the East Shore of Staten Island extending to Hylan Boulevard. Three to six feet of inundation occurs on the South Shore along the southeast tip of the island. Two to six feet of inundation occurs along Arthur Kill.Flooding up to the Oradell Dam in Hackensack and Dundee Dam in Passaic. Inundation of all of Hoboken east of NJ Transit line with three to sevel feet at Waterfront.Inundation of all of Jersey City east of 1-78 with three to five feet at Waterfront.
- 9.3 - Inundation of one to two feet occurs at the Hoboken Terminal and the Hoboken Waterfront.
- 8.5 - Inundation occurs on Bellville Turnpike (Route 7) near the Hackensack River, in Kearney, New Jersey.
Gauge Info
| Coordinates | 40.5389, -74.1297 |
| RFC | NERFC |
| State | NY |
| WFO | OKX |
| County | Richmond |
| Data Provider(s) | |
| US Geological Survey | USGS--Water Resources of the United States |
| USGS | 01376562 |
Gauge Location
Gauge Photos
No Images Found
Probability Information
No Images Available
Unique Local Info
|
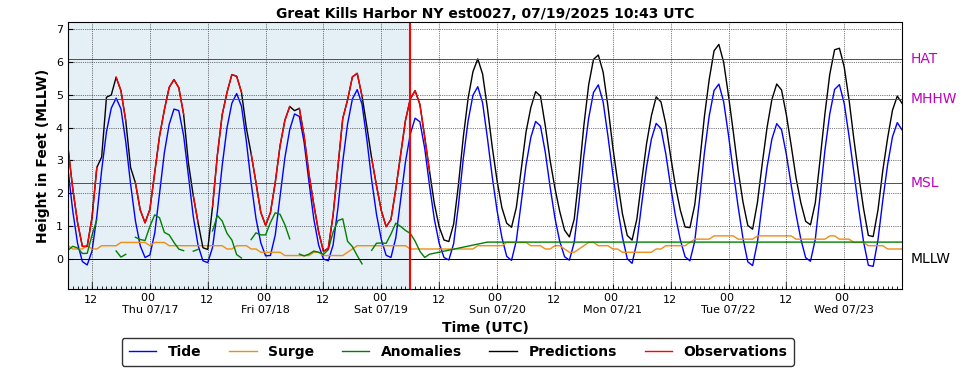
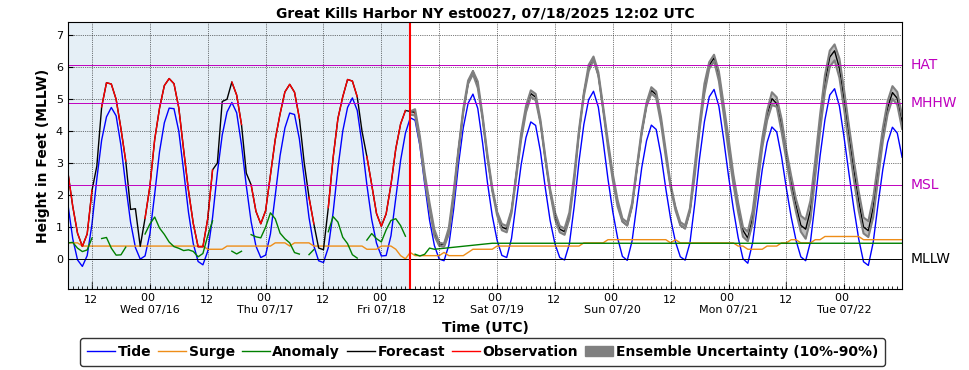
Potential Tide Levels Used to Estimate the Chance of Flooding and the Range of Possible Tide Levels |
||
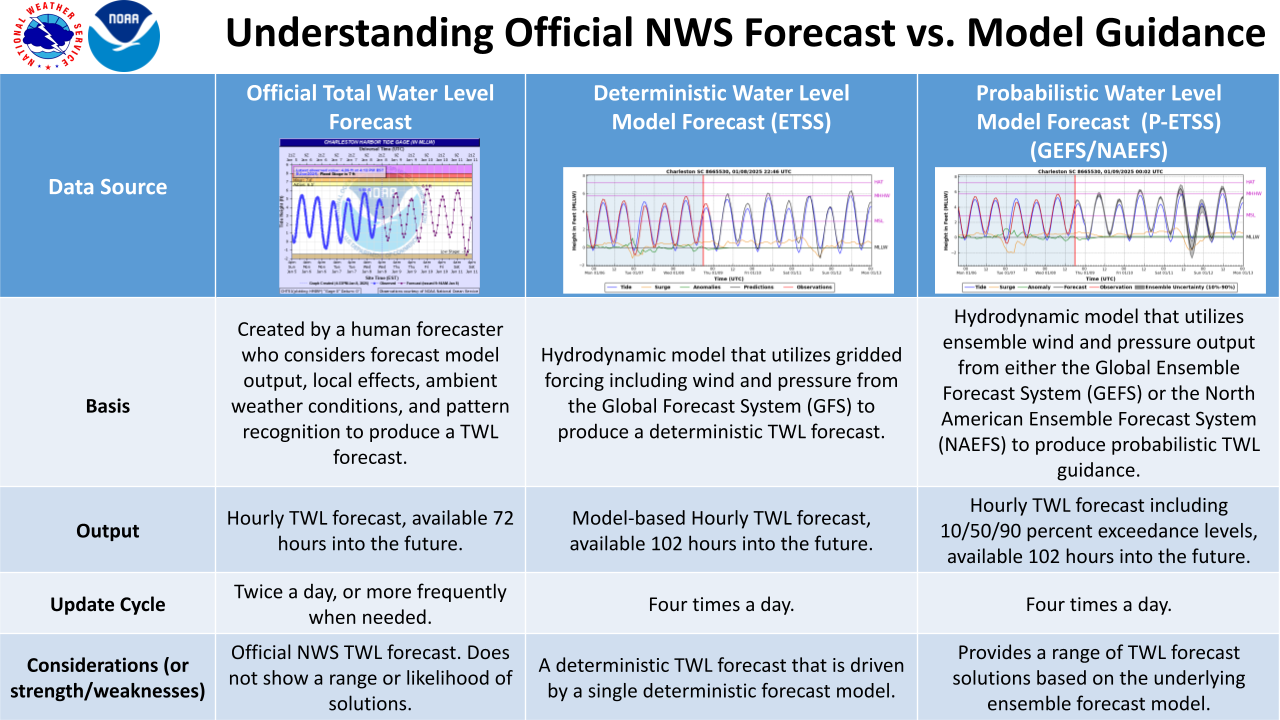
| GFS Based Guidance (ETSS) | GEFS Based Guidance (P-ETSS) | NAEFS Based Guidance (P-ETSS) |
 |
 |
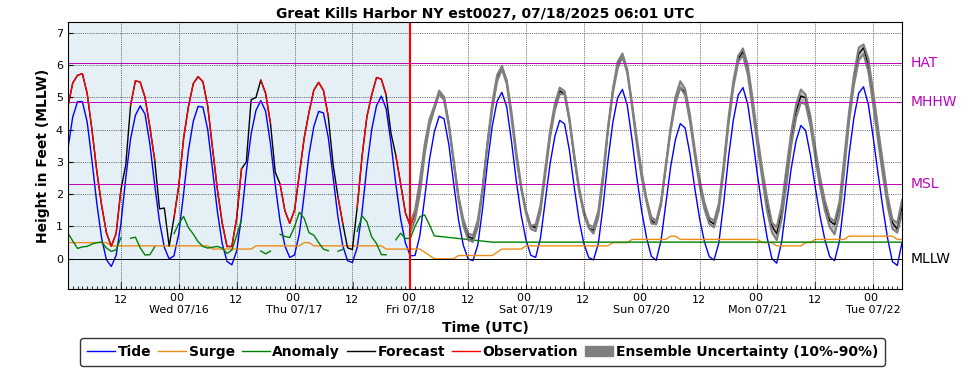 |
Note: Use the official hydrograph at the top of this web page for tide levels within the next 72 hours.
The Potential Tide Level graphics above are from an EXPERIMENTAL web site. It is supported on an 8x5 basis, and has no guarantee of availability in the future. Please see information HERE to understand the strengths and weakness of the Potential Tide Level graphics. Click individual graphics to enlarge.
Collaborative Agencies
The National Weather Service prepares its forecasts and other services in collaboration with agencies like the US Geological Survey, US Bureau of Reclamation, US Army Corps of Engineers, Natural Resource Conservation Service, National Park Service, ALERT Users Group, Bureau of Indian Affairs, and many state and local emergency managers across the country. For details, please click here.