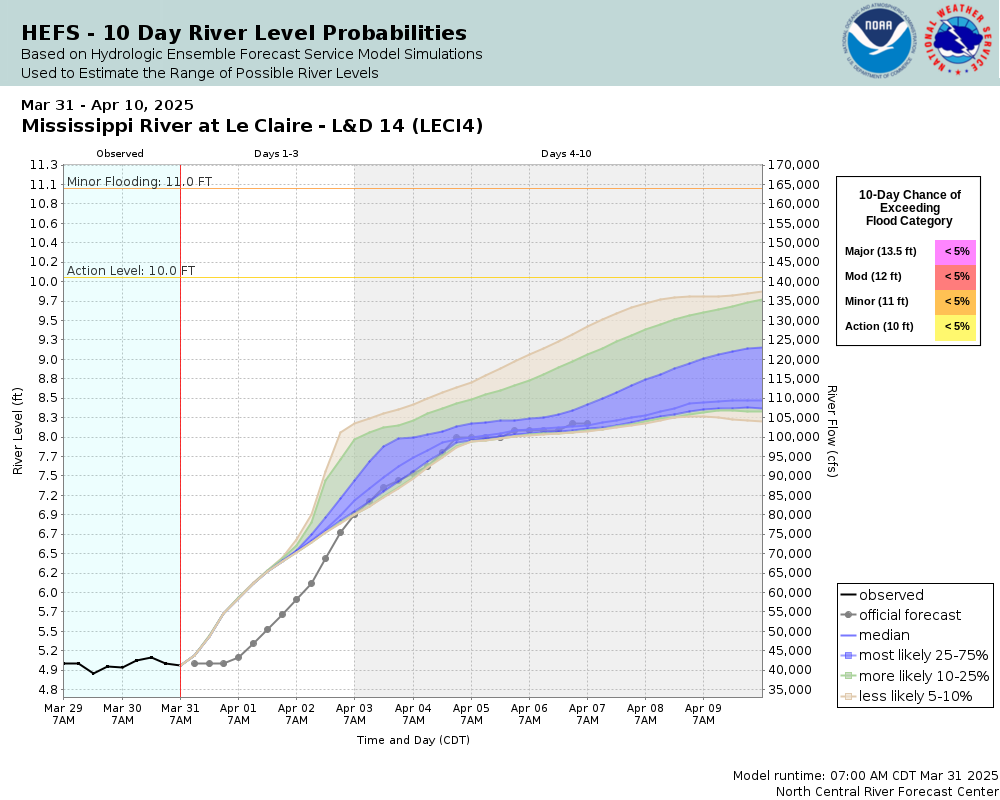
Mississippi River at LeClaire
Future / Actual / Minor
OWP 2.0 WWA Modal Title
01/11/2021, 10:04 PM UTC through 01/11/2021, 10:04 PM UTC
Sender
Sent
- Warning: no valid ratings curve available. Transformations to and from FEET/CFS/KCFS will not happen.
Traces and Thresholds Click to turn on/off display
Observed (OBS) 03/28/2025 11:30 AM CDTOfficial Forecast (FCST) 03/28/2025 10:30 AM CDTRecord: 17.8 ftCATEGORY STAGE 
Major Flooding 13.5 ft Moderate Flooding 12 ft Minor Flooding 11 ft Action 10 ft Reliability of the Forecast:
NOTE: Forecasts are issued routinely year-round.
River forecasts for this location take into account past precipitation and the precipitation amounts expected approximately 48 hours into the future from the forecast issuance time.
National Water Model Hydrograph
Official NWS streamflow forecasts are produced by NWS hydrologic forecasters for river gauge locations using hydrologic models which are calibrated to that location. This process considers additional guidance and information, including local expertise and experience, to produce the best forecast possible. The NWM output provides supplemental guidance to NWS forecasters and should not be considered an official NWS river forecast.
Flood Impacts
- 19 - Water reaches the bottom of the access bridge to Campbells Island. Water affects North Main Street in Port Byron, affecting many businesses. Water affects 1st Avenue and affects several houses in Hampton.
- 17.5 - Water affects the bridge approach on the island side of Campbell's Island.
- 17.3 - Water affects the Buffalo Bill Museum in Le Claire. Water is also on the railroad tracks.
Gauge Info
| Coordinates | 41.5744, -90.4031 |
| RFC | NCRFC |
| State | IA |
| WFO | DVN |
| County | Scott |
| Data Provider(s) | |
| U.S. Army Corps of Engineers | U.S. Army Corps of Engineers |
| COE | Website |
Gauge Location
Recent Crests
| 1. | 14.42 ft | on 07-09-2024 | (P) |
| 2. | 16.18 ft | on 05-01-2023 | (P) |
| 3. | 16.50 ft | on 05-02-2019 | |
| 4. | 12.25 ft | on 05-10-2018 | |
| 5. | 11.47 ft | on 06-01-2017 |
Recent Crests
| 1. | 14.42 ft | on 07-09-2024 | (P) |
| 2. | 16.18 ft | on 05-01-2023 | (P) |
| 3. | 16.50 ft | on 05-02-2019 | |
| 4. | 12.25 ft | on 05-10-2018 | |
| 5. | 11.47 ft | on 06-01-2017 | |
| 6. | 10.76 ft | on 09-30-2016 | |
| 7. | 8.96 ft | on 06-16-2015 | |
| 8. | 14.45 ft | on 07-03-2014 | |
| 9. | 12.57 ft | on 04-20-2013 | |
| 10. | 14.97 ft | on 04-22-2011 | |
| 11. | 11.05 ft | on 04-04-2011 | |
| 12. | 14.84 ft | on 06-16-2008 | |
| 13. | 13.48 ft | on 04-29-2008 | |
| 14. | 11.35 ft | on 06-21-2004 | |
| 15. | 16.93 ft | on 04-24-2001 | |
| 16. | 11.65 ft | on 04-12-1998 | |
| 17. | 14.61 ft | on 04-19-1997 | |
| 18. | 11.90 ft | on 05-02-1996 | |
| 19. | 16.56 ft | on 07-08-1993 | |
| 20. | 13.60 ft | on 10-07-1986 | |
| 21. | 12.24 ft | on 03-19-1983 | |
| 22. | 11.12 ft | on 04-30-1982 | |
| 23. | 14.03 ft | on 05-08-1975 | |
| 24. | 11.15 ft | on 06-24-1974 | |
| 25. | 13.62 ft | on 03-26-1973 | |
| 26. | 14.60 ft | on 04-26-1969 | |
| 27. | 13.17 ft | on 04-15-1967 | |
| 28. | 17.75 ft | on 04-28-1965 | |
| 29. | 11.50 ft | on 05-15-1954 | |
| 30. | 14.01 ft | on 04-28-1952 | |
| 31. | 13.74 ft | on 04-28-1951 | |
| 32. | 11.02 ft | on 03-30-1945 | |
| 33. | 12.26 ft | on 06-29-1944 | |
| 34. | 11.20 ft | on 06-13-1942 |
Historic Crests
| 1. | 17.75 ft | on 04-28-1965 | |
| 2. | 16.93 ft | on 04-24-2001 | |
| 3. | 16.56 ft | on 07-08-1993 | |
| 4. | 16.50 ft | on 05-02-2019 | |
| 5. | 16.18 ft | on 05-01-2023 | (P) |
Historic Crests
| 1. | 17.75 ft | on 04-28-1965 | |
| 2. | 16.93 ft | on 04-24-2001 | |
| 3. | 16.56 ft | on 07-08-1993 | |
| 4. | 16.50 ft | on 05-02-2019 | |
| 5. | 16.18 ft | on 05-01-2023 | (P) |
| 6. | 14.97 ft | on 04-22-2011 | |
| 7. | 14.84 ft | on 06-16-2008 | |
| 8. | 14.61 ft | on 04-19-1997 | |
| 9. | 14.60 ft | on 04-26-1969 | |
| 10. | 14.45 ft | on 07-03-2014 | |
| 11. | 14.42 ft | on 07-09-2024 | (P) |
| 12. | 14.03 ft | on 05-08-1975 | |
| 13. | 14.01 ft | on 04-28-1952 | |
| 14. | 13.74 ft | on 04-28-1951 | |
| 15. | 13.62 ft | on 03-26-1973 | |
| 16. | 13.60 ft | on 10-07-1986 | |
| 17. | 13.48 ft | on 04-29-2008 | |
| 18. | 13.17 ft | on 04-15-1967 | |
| 19. | 12.57 ft | on 04-20-2013 | |
| 20. | 12.26 ft | on 06-29-1944 | |
| 21. | 12.25 ft | on 05-10-2018 | |
| 22. | 12.24 ft | on 03-19-1983 | |
| 23. | 11.90 ft | on 05-02-1996 | |
| 24. | 11.65 ft | on 04-12-1998 | |
| 25. | 11.50 ft | on 05-15-1954 | |
| 26. | 11.47 ft | on 06-01-2017 | |
| 27. | 11.35 ft | on 06-21-2004 | |
| 28. | 11.20 ft | on 06-13-1942 | |
| 29. | 11.15 ft | on 06-24-1974 | |
| 30. | 11.12 ft | on 04-30-1982 | |
| 31. | 11.05 ft | on 04-04-2011 | |
| 32. | 11.02 ft | on 03-30-1945 | |
| 33. | 10.76 ft | on 09-30-2016 | |
| 34. | 8.96 ft | on 06-16-2015 |
Vertical Datum Table
| type | MSL |
|---|---|
| major Flooding | 570.60 ft |
| moderate Flooding | 569.10 ft |
| minor Flooding | 568.10 ft |
| action | 567.10 ft |
| Latest Value | 562.29 ft |
| Gauge Zero | 557.10 ft |
Gauge Photos
No Images Found

Unique Local Info
Collaborative Agencies
The National Weather Service prepares its forecasts and other services in collaboration with agencies like the US Geological Survey, US Bureau of Reclamation, US Army Corps of Engineers, Natural Resource Conservation Service, National Park Service, ALERT Users Group, Bureau of Indian Affairs, and many state and local emergency managers across the country. For details, please click here.