Tippecanoe River at Oakdale Dam
Future / Actual / Minor
OWP 2.0 WWA Modal Title
01/11/2021, 10:04 PM UTC through 01/11/2021, 10:04 PM UTC
Sender
Sent
- Warning: no valid ratings curve available. Transformations to and from FEET/CFS/KCFS will not happen.
Traces and Thresholds Click to turn on/off display
Observed (OBS) 06/16/2025 11:45 PM EDTOfficial Forecast (FCST) 06/16/2025 8:34 PM EDTRecord: 30.16 cfsCATEGORY FLOW 
Major Flooding 22 kcfs Moderate Flooding 18 kcfs Minor Flooding 13 kcfs Action 9 kcfs Reliability of the Forecast:
NOTE: Forecasts are issued routinely year-round.
Gauge reading affected by power generation.
National Water Model Hydrograph
Official NWS streamflow forecasts are produced by NWS hydrologic forecasters for river gauge locations using hydrologic models which are calibrated to that location. This process considers additional guidance and information, including local expertise and experience, to produce the best forecast possible. The NWM output provides supplemental guidance to NWS forecasters and should not be considered an official NWS river forecast.
Flood Impacts
- 66000 - Maximum flow through the spillway with the water level at the top of earthen embankment. Flooding with catastrophic impacts. Complete evacuation of all people downstream of Oakdale Dam in flood prone areas is necessary. Flooding closes all county roads near the river and possibly SR 18. Extensive property damage and possible overtopping of Oakdale Dam. Extensively flooded areas include Horseshoe Bend and Camp Tecumseh downstream of Oakdale Dam.
- 32500 - Estimated 100-year recurrence interval flood. A record flood with devastating impacts. Evacuation of many people downstream of Oakdale Dam with flows approaching 32,000 cubic feet per second. Possibly more than 500 residences flooded. Flooding closes many local roads. Extensive property damage. Flooded areas include Horseshoe Bend and Camp Tecumseh downstream of Oakdale Dam.
- 30000 - All residents south of Oakdale Dam may need to evacuate.
Gauge Info
| Coordinates | 40.6567, -86.7528 |
| RFC | OHRFC |
| State | IN |
| WFO | IND |
| County | White |
| Data Provider(s) | |
| US Geological Survey | Northern Indiana Public Service Company (NIPSCO) |
Gauge Location
Recent Crests
| 1. | 11.00 ft | on 07-12-2017 |
| 2. | 13.05 ft | on 01-20-2017 |
| 3. | 16.01 ft | on 12-29-2015 |
| 4. | 17.95 ft | on 06-16-2015 |
| 5. | 11.10 ft | on 04-04-2014 |
Recent Crests
| 1. | 11.00 ft | on 07-12-2017 |
| 2. | 13.05 ft | on 01-20-2017 |
| 3. | 16.01 ft | on 12-29-2015 |
| 4. | 17.95 ft | on 06-16-2015 |
| 5. | 11.10 ft | on 04-04-2014 |
| 6. | 17.75 ft | on 06-01-2013 |
| 7. | 16.35 ft | on 04-19-2013 |
| 8. | 11.85 ft | on 01-30-2013 |
| 9. | 20.75 ft | on 03-11-2009 |
| 10. | 13.15 ft | on 02-12-2009 |
| 11. | 19.90 ft | on 02-06-2008 |
| 12. | 20.90 ft | on 01-08-2008 |
| 13. | 16.75 ft | on 07-10-2003 |
| 14. | 16.10 ft | on 07-09-2003 |
| 15. | 15.75 ft | on 07-06-2003 |
| 16. | 13.80 ft | on 05-08-1998 |
| 17. | 12.56 ft | on 01-09-1998 |
| 18. | 14.77 ft | on 02-27-1997 |
| 19. | 17.50 ft | on 04-11-1994 |
| 20. | 17.05 ft | on 12-30-1990 |
| 21. | 17.50 ft | on 02-24-1985 |
| 22. | 17.90 ft | on 02-10-1959 |
Historic Crests
| 1. | 20.90 ft | on 01-08-2008 |
| 2. | 20.75 ft | on 03-11-2009 |
| 3. | 19.90 ft | on 02-06-2008 |
| 4. | 17.95 ft | on 06-16-2015 |
| 5. | 17.90 ft | on 02-10-1959 |
Historic Crests
| 1. | 20.90 ft | on 01-08-2008 |
| 2. | 20.75 ft | on 03-11-2009 |
| 3. | 19.90 ft | on 02-06-2008 |
| 4. | 17.95 ft | on 06-16-2015 |
| 5. | 17.90 ft | on 02-10-1959 |
| 6. | 17.75 ft | on 06-01-2013 |
| 7. | 17.50 ft | on 04-11-1994 |
| 8. | 17.50 ft | on 02-24-1985 |
| 9. | 17.05 ft | on 12-30-1990 |
| 10. | 16.75 ft | on 07-10-2003 |
| 11. | 16.35 ft | on 04-19-2013 |
| 12. | 16.10 ft | on 07-09-2003 |
| 13. | 16.01 ft | on 12-29-2015 |
| 14. | 15.75 ft | on 07-06-2003 |
| 15. | 14.77 ft | on 02-27-1997 |
| 16. | 13.80 ft | on 05-08-1998 |
| 17. | 13.15 ft | on 02-12-2009 |
| 18. | 13.05 ft | on 01-20-2017 |
| 19. | 12.56 ft | on 01-09-1998 |
| 20. | 11.85 ft | on 01-30-2013 |
| 21. | 11.10 ft | on 04-04-2014 |
| 22. | 11.00 ft | on 07-12-2017 |


Unique Local Info
|
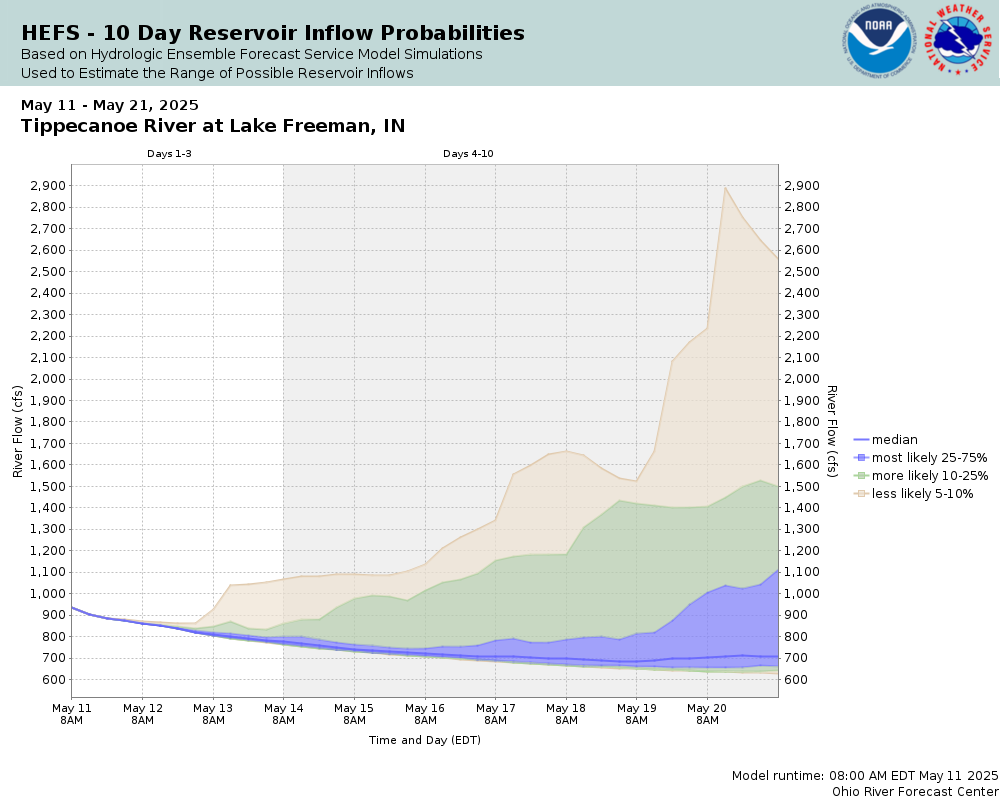
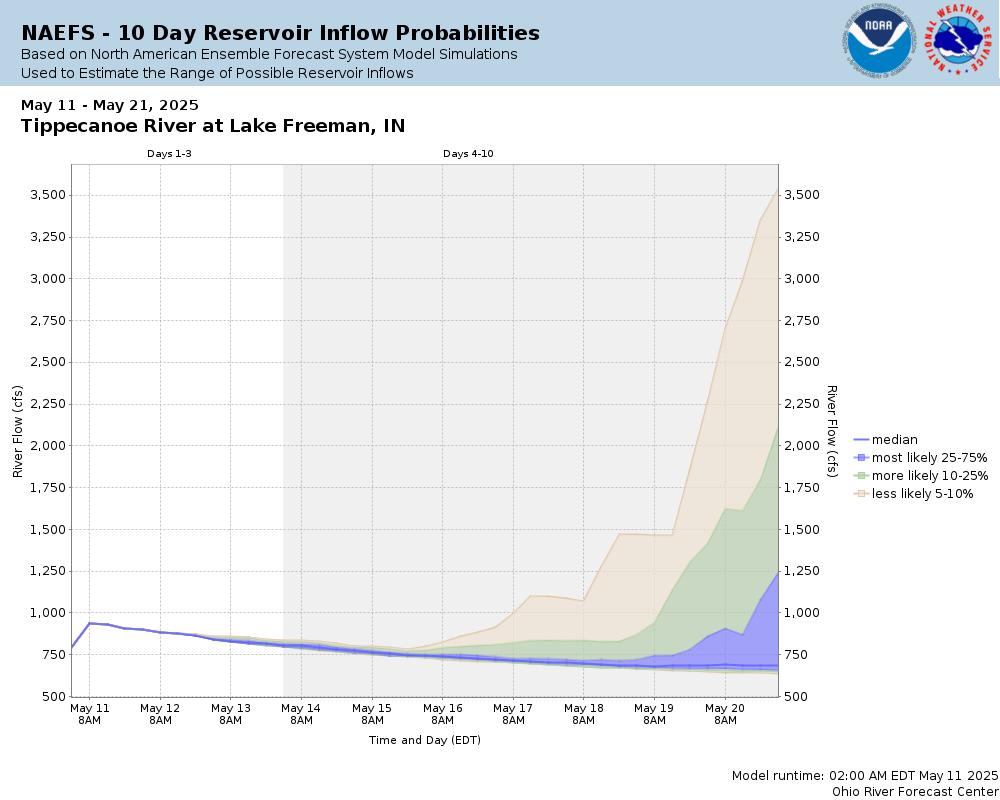
Potential River Levels Used to Estimate the Chance of Flooding and the Range of Possible River Levels |
||
| 10 Day (HEFS) | 10 Day (NAEFS) | 10 Day (GEFS) |
 |
 |
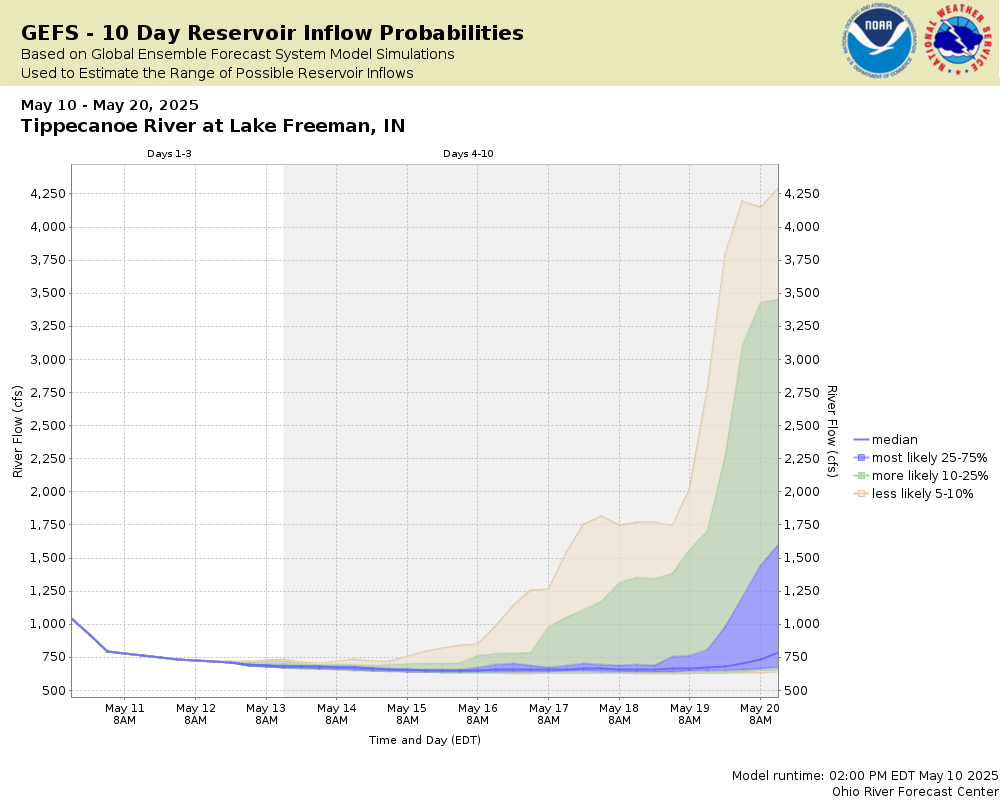 |
Note: Use the official hydrograph at the top of this web page for river levels within the next 72 hours.
Click individual graphics to enlarge.
NIPSCO Current Lake and Discharge LevelsThis river site is operated by NIPSCO. Some historical river data for this site is also displayed on this page.
Collaborative Agencies
The National Weather Service prepares its forecasts and other services in collaboration with agencies like the US Geological Survey, US Bureau of Reclamation, US Army Corps of Engineers, Natural Resource Conservation Service, National Park Service, ALERT Users Group, Bureau of Indian Affairs, and many state and local emergency managers across the country. For details, please click here.
Resources
Hydrologic Resource Links
- River Forecast Centers
- Text Products
- Forecast Precipitation
- US Geological Survey Surface Water
- How to Use US Geological Survey Water Alert Feature
- Water Resources Outlook
- Wabash River Conservation Area
- Water flow from Norway and Oakdale Dams
- Indianapolis Reservoir Levels
- Midwest Region U.S. Drought Monitor
- Indianapolis Museum of Art: FLOW Can You See the River?
- The Flood of 1913 - Remembered
- Friends of the White River
Additional Resource Links
- NWS Precipitation and River Forecasting
- Area Hydrographs
- Zoomable RFC Hourly Precipitation Maps
- Zoomable Snowfall Maps
- Indiana State Climate Office
- Community Collaborative Rain, Hail & Snow Network in Indiana
- Snow Information
- Midwestern Regional Climate Center
- Indiana Precipitation Frequencies
- Drainage Areas of Indiana Streams
- Ensemble River Forecasts
- Ohio River Forecast Center