Appomattox River at Matoaca
Future / Actual / Minor
OWP 2.0 WWA Modal Title
01/11/2021, 10:04 PM UTC through 01/11/2021, 10:04 PM UTC
Sender
Sent
- Downstream gauge unavailableWarning: no valid ratings curve available. Transformations to and from FEET/CFS/KCFS will not happen.
Traces and Thresholds Click to turn on/off display
Observed (OBS) 06/28/2025 6:45 AM EDTOfficial Forecast (FCST) 06/27/2025 9:02 PM EDTRecord: 18.4 ftCATEGORY STAGE 
Major Flooding 15 ft Moderate Flooding 13 ft Minor Flooding 10 ft Action 8 ft Reliability of the Forecast:
NOTE: Forecasts are issued routinely year-round.
Gauge reading affected by reservoir operations.
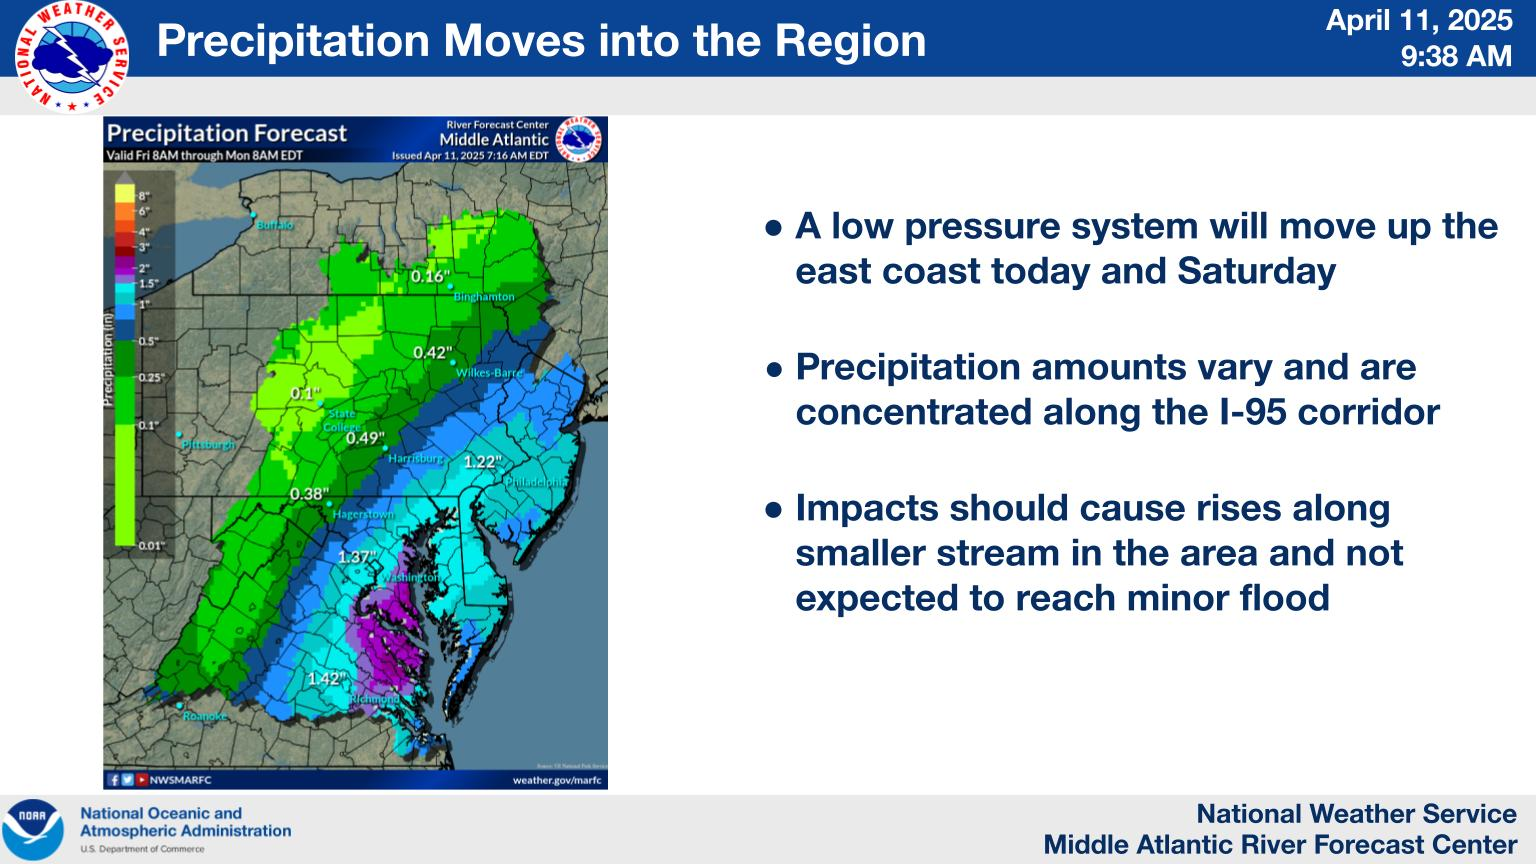
River forecasts for this location take into account past precipitation and the precipitation amounts expected approximately 72 hours into the future from the forecast issuance time.
National Water Model Hydrograph
Official NWS streamflow forecasts are produced by NWS hydrologic forecasters for river gauge locations using hydrologic models which are calibrated to that location. This process considers additional guidance and information, including local expertise and experience, to produce the best forecast possible. The NWM output provides supplemental guidance to NWS forecasters and should not be considered an official NWS river forecast.
Flood Impacts
- 36.08 - Elevation of the Pickett Avenue Bridge floor on southern end. Northern end of bridge is under water.
- 33.32 - Height of the bottom of Pickett Avenue Bridge floor support beam on southern end. Northern end of bridge is under water.
- 26.2 - River stage sensor operating limit
- 22.78 - Elevation of Pickett Avenue Bridge...State Route 600...bridge floor on northern end of bridge.
- 18.86 - Height of the bottom of the bridge support beam on northern end of Pickett Avenue Bridge...State Route 600.
- 17 - Near flood of record. Residential areas flooded.
- 15 - Major flooding begins. Secondary roads begin to flood. Some residential areas are threatened.
- 13 - Moderate flooding begins. Portions of Old Town Petersburg begin to flood.
- 10 - Minor flooding begins. Canal begins to overflow along the right bank.
Gauge Info
| Coordinates | 37.2250, -77.4756 |
| RFC | MARFC |
| State | VA |
| WFO | AKQ |
| County | Chesterfield |
| Data Provider(s) | |
| US Geological Survey | USGS--Water Resources of the United States |
| USGS | 02041650 |
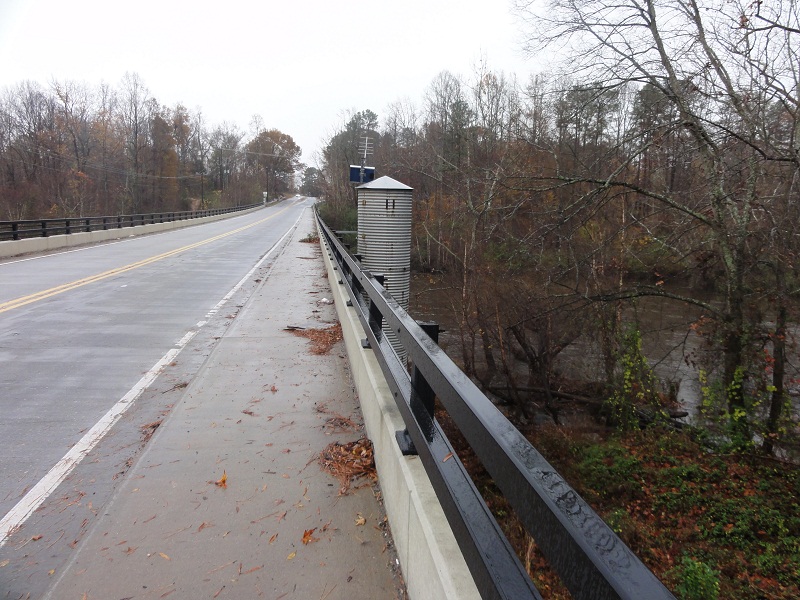
Gauge Location
Recent Crests
| 1. | 10.62 ft | on 02-18-2025 | (P) |
| 2. | 9.95 ft | on 01-15-2024 | |
| 3. | 10.52 ft | on 01-13-2024 | (P) |
| 4. | 10.52 ft | on 01-12-2024 | |
| 5. | 10.58 ft | on 11-17-2020 |
Recent Crests
| 1. | 10.62 ft | on 02-18-2025 | (P) |
| 2. | 9.95 ft | on 01-15-2024 | |
| 3. | 10.52 ft | on 01-13-2024 | (P) |
| 4. | 10.52 ft | on 01-12-2024 | |
| 5. | 10.58 ft | on 11-17-2020 | |
| 6. | 7.96 ft | on 03-23-2019 | |
| 7. | 8.55 ft | on 02-25-2019 | |
| 8. | 8.83 ft | on 11-18-2018 | |
| 9. | 13.86 ft | on 10-14-2018 | |
| 10. | 9.85 ft | on 09-20-2018 | |
| 11. | 10.38 ft | on 05-20-2018 | |
| 12. | 7.92 ft | on 05-08-2016 | |
| 13. | 8.22 ft | on 02-26-2016 | |
| 14. | 11.34 ft | on 12-26-2015 | |
| 15. | 9.20 ft | on 05-22-2014 | |
| 16. | 9.13 ft | on 05-03-2014 | |
| 17. | 8.52 ft | on 01-18-2013 | |
| 18. | 9.50 ft | on 03-31-2010 | |
| 19. | 8.62 ft | on 02-08-2010 | |
| 20. | 8.76 ft | on 12-28-2009 | |
| 21. | 9.23 ft | on 12-16-2009 | |
| 22. | 9.96 ft | on 11-15-2009 | |
| 23. | 9.30 ft | on 12-14-2008 | |
| 24. | 8.17 ft | on 05-12-2008 | |
| 25. | 10.29 ft | on 11-16-2006 | |
| 26. | 10.73 ft | on 10-09-2006 | |
| 27. | 8.39 ft | on 01-17-2005 | |
| 28. | 13.57 ft | on 08-31-2004 | |
| 29. | 10.96 ft | on 08-03-2004 | |
| 30. | 12.86 ft | on 09-20-2003 | |
| 31. | 14.61 ft | on 05-26-2003 | |
| 32. | 10.14 ft | on 04-11-2003 | |
| 33. | 10.37 ft | on 03-23-2003 | |
| 34. | 8.98 ft | on 02-25-2003 | |
| 35. | 9.16 ft | on 04-01-2001 | |
| 36. | 9.13 ft | on 04-19-2000 | |
| 37. | 11.58 ft | on 09-16-1999 | |
| 38. | 11.97 ft | on 03-21-1998 | |
| 39. | 10.02 ft | on 01-30-1998 | |
| 40. | 9.13 ft | on 12-08-1996 | |
| 41. | 11.17 ft | on 09-12-1996 | |
| 42. | 10.00 ft | on 01-20-1996 | |
| 43. | 10.26 ft | on 04-02-1994 | |
| 44. | 11.10 ft | on 03-04-1994 | |
| 45. | 8.47 ft | on 02-26-1994 | |
| 46. | 10.37 ft | on 12-03-1993 | |
| 47. | 11.32 ft | on 03-06-1993 | |
| 48. | 9.28 ft | on 03-08-1992 | |
| 49. | 9.05 ft | on 03-31-1991 | |
| 50. | 8.52 ft | on 06-01-1990 | |
| 51. | 9.20 ft | on 05-08-1989 | |
| 52. | 12.04 ft | on 04-18-1987 | |
| 53. | 12.07 ft | on 11-06-1985 | |
| 54. | 8.62 ft | on 02-03-1985 | |
| 55. | 12.63 ft | on 02-16-1984 | |
| 56. | 10.61 ft | on 03-21-1983 | |
| 57. | 13.09 ft | on 10-03-1979 | |
| 58. | 11.80 ft | on 09-24-1979 | |
| 59. | 14.37 ft | on 02-26-1979 | |
| 60. | 11.40 ft | on 05-02-1978 | |
| 61. | 11.98 ft | on 03-12-1978 | |
| 62. | 9.22 ft | on 01-29-1976 | |
| 63. | 12.31 ft | on 03-19-1975 | |
| 64. | 9.19 ft | on 12-23-1973 | |
| 65. | 10.65 ft | on 02-06-1973 | |
| 66. | 18.39 ft | on 10-07-1972 | |
| 67. | 14.60 ft | on 06-27-1972 | |
| 68. | 14.10 ft | on 10-25-1971 | |
| 69. | 10.70 ft | on 05-31-1971 |
Historic Crests
| 1. | 18.39 ft | on 10-07-1972 |
| 2. | 14.61 ft | on 05-26-2003 |
| 3. | 14.60 ft | on 06-27-1972 |
| 4. | 14.37 ft | on 02-26-1979 |
| 5. | 14.10 ft | on 10-25-1971 |
Historic Crests
| 1. | 18.39 ft | on 10-07-1972 | |
| 2. | 14.61 ft | on 05-26-2003 | |
| 3. | 14.60 ft | on 06-27-1972 | |
| 4. | 14.37 ft | on 02-26-1979 | |
| 5. | 14.10 ft | on 10-25-1971 | |
| 6. | 13.86 ft | on 10-14-2018 | |
| 7. | 13.57 ft | on 08-31-2004 | |
| 8. | 13.09 ft | on 10-03-1979 | |
| 9. | 12.86 ft | on 09-20-2003 | |
| 10. | 12.63 ft | on 02-16-1984 | |
| 11. | 12.31 ft | on 03-19-1975 | |
| 12. | 12.07 ft | on 11-06-1985 | |
| 13. | 12.04 ft | on 04-18-1987 | |
| 14. | 11.98 ft | on 03-12-1978 | |
| 15. | 11.97 ft | on 03-21-1998 | |
| 16. | 11.80 ft | on 09-24-1979 | |
| 17. | 11.58 ft | on 09-16-1999 | |
| 18. | 11.40 ft | on 05-02-1978 | |
| 19. | 11.34 ft | on 12-26-2015 | |
| 20. | 11.32 ft | on 03-06-1993 | |
| 21. | 11.17 ft | on 09-12-1996 | |
| 22. | 11.10 ft | on 03-04-1994 | |
| 23. | 10.96 ft | on 08-03-2004 | |
| 24. | 10.73 ft | on 10-09-2006 | |
| 25. | 10.70 ft | on 05-31-1971 | |
| 26. | 10.65 ft | on 02-06-1973 | |
| 27. | 10.62 ft | on 02-18-2025 | (P) |
| 28. | 10.61 ft | on 03-21-1983 | |
| 29. | 10.58 ft | on 11-17-2020 | |
| 30. | 10.52 ft | on 01-12-2024 | |
| 31. | 10.52 ft | on 01-13-2024 | (P) |
| 32. | 10.38 ft | on 05-20-2018 | |
| 33. | 10.37 ft | on 12-03-1993 | |
| 34. | 10.37 ft | on 03-23-2003 | |
| 35. | 10.29 ft | on 11-16-2006 | |
| 36. | 10.26 ft | on 04-02-1994 | |
| 37. | 10.14 ft | on 04-11-2003 | |
| 38. | 10.02 ft | on 01-30-1998 | |
| 39. | 10.00 ft | on 01-20-1996 | |
| 40. | 9.96 ft | on 11-15-2009 | |
| 41. | 9.95 ft | on 01-15-2024 | |
| 42. | 9.85 ft | on 09-20-2018 | |
| 43. | 9.50 ft | on 03-31-2010 | |
| 44. | 9.30 ft | on 12-14-2008 | |
| 45. | 9.28 ft | on 03-08-1992 | |
| 46. | 9.23 ft | on 12-16-2009 | |
| 47. | 9.22 ft | on 01-29-1976 | |
| 48. | 9.20 ft | on 05-08-1989 | |
| 49. | 9.20 ft | on 05-22-2014 | |
| 50. | 9.19 ft | on 12-23-1973 | |
| 51. | 9.16 ft | on 04-01-2001 | |
| 52. | 9.13 ft | on 05-03-2014 | |
| 53. | 9.13 ft | on 12-08-1996 | |
| 54. | 9.13 ft | on 04-19-2000 | |
| 55. | 9.05 ft | on 03-31-1991 | |
| 56. | 8.98 ft | on 02-25-2003 | |
| 57. | 8.83 ft | on 11-18-2018 | |
| 58. | 8.76 ft | on 12-28-2009 | |
| 59. | 8.62 ft | on 02-03-1985 | |
| 60. | 8.62 ft | on 02-08-2010 | |
| 61. | 8.55 ft | on 02-25-2019 | |
| 62. | 8.52 ft | on 01-18-2013 | |
| 63. | 8.52 ft | on 06-01-1990 | |
| 64. | 8.47 ft | on 02-26-1994 | |
| 65. | 8.39 ft | on 01-17-2005 | |
| 66. | 8.22 ft | on 02-26-2016 | |
| 67. | 8.17 ft | on 05-12-2008 | |
| 68. | 7.96 ft | on 03-23-2019 | |
| 69. | 7.92 ft | on 05-08-2016 |
Vertical Datum Table
| type | NAVD88 |
|---|---|
| major Flooding | 82.06 ft |
| moderate Flooding | 80.06 ft |
| minor Flooding | 77.06 ft |
| action | 75.06 ft |
| Latest Value | 68.97 ft |
| Gauge Zero | 67.06 ft |


Unique Local Info
|
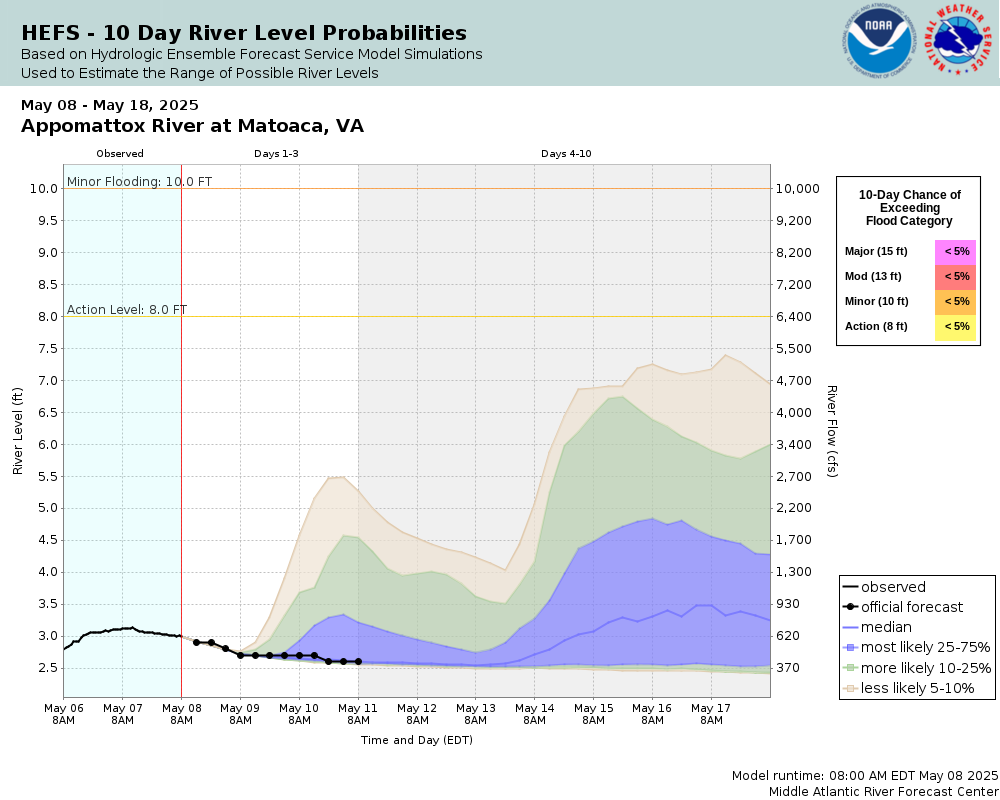
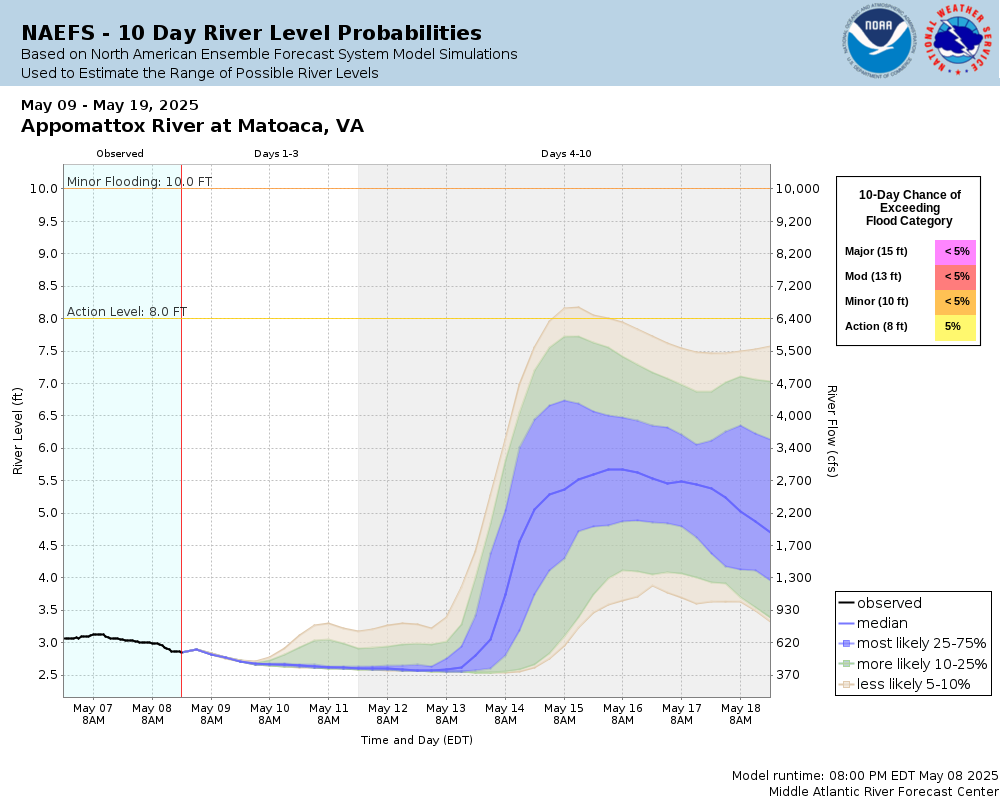
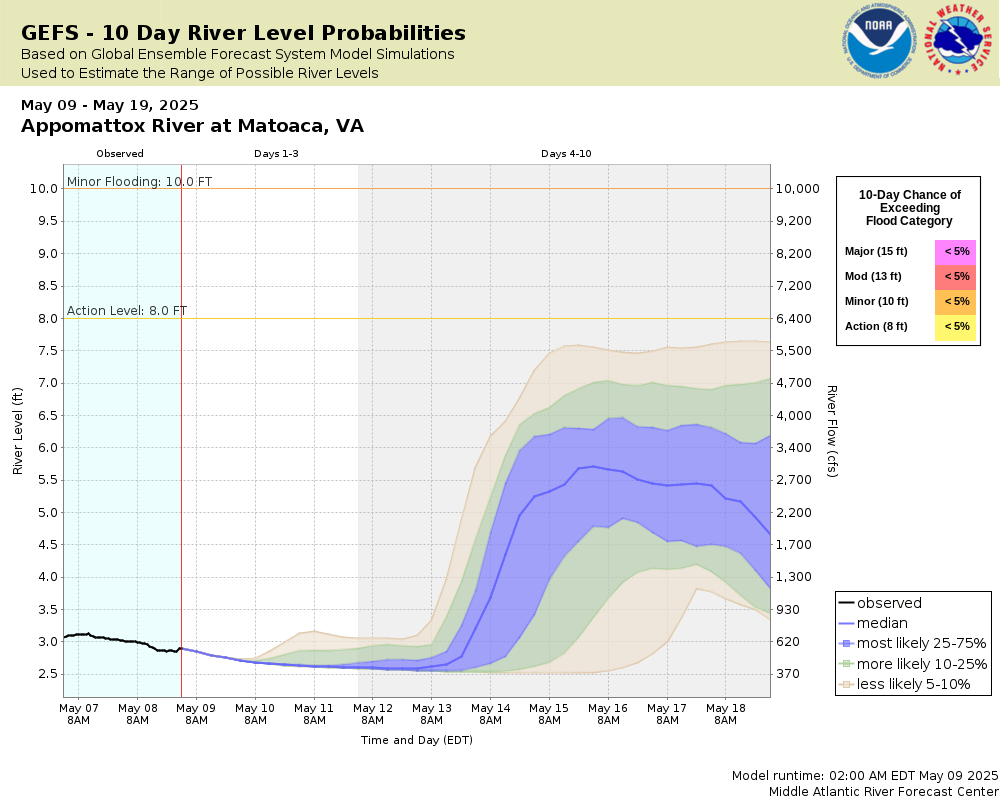
Potential River Levels Used to Estimate the Chance of Flooding and the Range of Possible River Levels |
||
| 10 Day (HEFS) | 10 Day (NAEFS) | 10 Day (GEFS) |
 |
 Â Â |
 Â Â |
Note: Use the official hydrograph at the top of this web page for river levels within the next 72 hours.
See the Product Description Document link for more details on the interpretation of the 7,10 day graphics.Â
Click individual graphics to enlarge.
|
|
|
|
|
||||||||
|
Additional Water and Weather Topics from the
Middle Atlantic River Forecast Center (MARFC): |
|||||||||||
Collaborative Agencies
The National Weather Service prepares its forecasts and other services in collaboration with agencies like the US Geological Survey, US Bureau of Reclamation, US Army Corps of Engineers, Natural Resource Conservation Service, National Park Service, ALERT Users Group, Bureau of Indian Affairs, and many state and local emergency managers across the country. For details, please click here.