Fort Pond Bay at Montauk (IN MLLW)
Future / Actual / Minor
OWP 2.0 WWA Modal Title
01/11/2021, 10:04 PM UTC through 01/11/2021, 10:04 PM UTC
Sender
Sent
- Upstream gauge unavailableDownstream gauge unavailableWarning: no valid ratings curve available. Transformations to and from FEET/CFS/KCFS will not happen.No secondary data available. Transformations for Flow data and a secondary Y axis cannot be made at this time.
Traces and Thresholds Click to turn on/off display
Observed (OBS) 07/04/2025 2:36 PM EDTOfficial Forecast (FCST) 07/04/2025 4:19 AM EDTLow Threshold: -1.8 ftCATEGORY STAGE 
Major Flooding 6.6 ft Moderate Flooding 4.9 ft Minor Flooding 4.1 ft Reliability of the Forecast: Forecast data shown here are guidance values only. Please refer to your local NWS office.
NOTE: Forecasts are issued routinely year-round.
National Water Model Hydrograph
Official NWS streamflow forecasts are produced by NWS hydrologic forecasters for river gauge locations using hydrologic models which are calibrated to that location. This process considers additional guidance and information, including local expertise and experience, to produce the best forecast possible. The NWM output provides supplemental guidance to NWS forecasters and should not be considered an official NWS river forecast.
Flood Impacts
- 7.1 - Inundation of one to week feet along the shoreline communities with three feet of inundation in South Jamesport, Laurel, Mecox, Ford Pond, and Westhampton Beach. Four to five feet of inundation occurs in East Marion. Two to three feet of inundation at Orient Point and along Mecox Bay in Bridgehampton with flooding onto Job Lane. Inundation occurs in Sag Harbor on Bay Street and Riverside Ave in Riverhead.Amagansett experiences one to two feet of flooding at the corner of Indian Wells Road and Bluff Road.
- 5.4 - Flooding occurs at Orient Beach State Park with one to two feet of inundation along several immediate ocean and bay adjacent streets.
- 4.9 - Significant flooding on Soundview Avenue. East Hampton experiences flooding on Gerald Drive, Napeague Meadow Road, and Soak Hides Road. Inundation occurs at several homes and the boat yard on Main Street in New Suffolk.
Gauge Location
Vertical Datum Table
| type | MLLW* | NAVD88 | MSL | MLW | MHW | MHHW* |
|---|---|---|---|---|---|---|
| major Flooding | 6.60 ft | 5.03 ft | 5.36 ft | 6.43 ft | 4.36 ft | 4.07 ft |
| moderate Flooding | 4.90 ft | 3.33 ft | 3.66 ft | 4.73 ft | 2.66 ft | 2.37 ft |
| minor Flooding | 4.10 ft | 2.53 ft | 2.86 ft | 3.93 ft | 1.86 ft | 1.57 ft |
| action | N/A | N/A | N/A | N/A | N/A | N/A |
| Latest Value | 2.13 ft | 0.56 ft | 0.89 ft | 1.96 ft | -0.11 ft | -0.40 ft |
| Gauge Zero | 0.00 ft | -1.57 ft | -1.24 ft | -0.17 ft | -2.24 ft | -2.53 ft |


Probability Information
No Images Available
Unique Local Info
Defined Datum Conversions Â
National Ocean Service - Definitions of Datums
Note: This hydrograph is displayed in the MLLW Datum (ft).
| Â | MLLW | NAVD88 | MSL | MLW | MHW | MHHW |
| Major Flood | 7 | 5.43 | 5.76 | 6.83 | 4.76 | 4.47 |
| Moderate Flood | 5.3 | 3.73 | 4.06 | 5.13 | 3.06 | 2.77 |
| Minor Flood | 4.5 | 2.93 | 3.26 | 4.33 | 2.26 | 1.97 |
|
Gage Zero |
 0 |  -1.57 | -1.24 | -0.17 | -2.24 | -2.53 |
|
Potential Tide Levels Used to Estimate the Chance of Flooding and the Range of Possible Tide Levels |
||
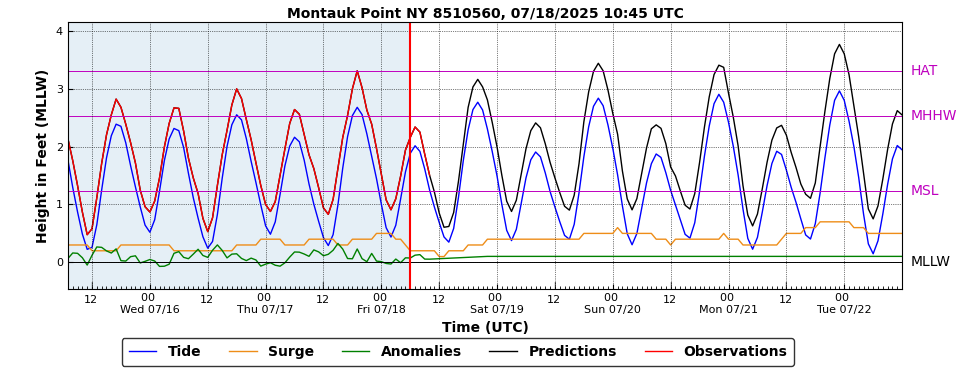
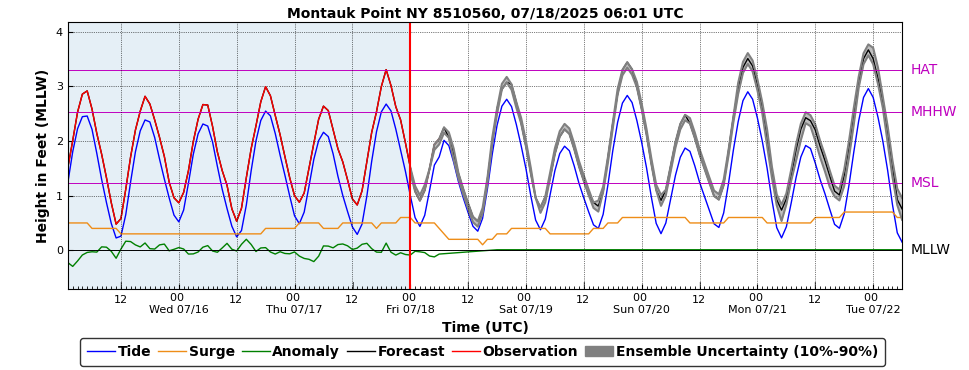
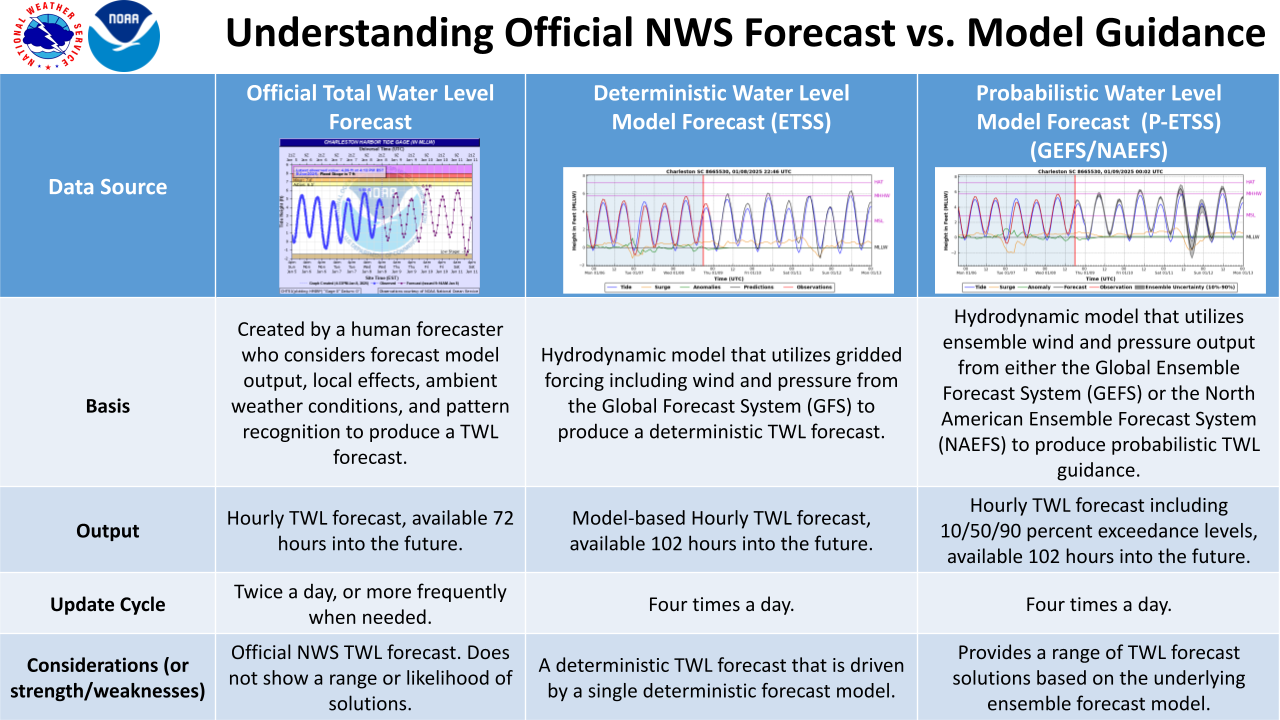
| GFS Based Guidance (ETSS) | GEFS Based Guidance (P-ETSS) | NAEFS Based Guidance (P-ETSS) |
 |
 |
 |
Note: Use the official hydrograph at the top of this web page for tide levels within the next 72 hours.
The Potential Tide Level graphics above are from an EXPERIMENTAL web site. It is supported on an 8x5 basis, and has no guarantee of availability in the future. Please see information HERE to understand the strengths and weakness of the Potential Tide Level graphics. Click individual graphics to enlarge.
Collaborative Agencies
The National Weather Service prepares its forecasts and other services in collaboration with agencies like the US Geological Survey, US Bureau of Reclamation, US Army Corps of Engineers, Natural Resource Conservation Service, National Park Service, ALERT Users Group, Bureau of Indian Affairs, and many state and local emergency managers across the country. For details, please click here.