Delaware River at Matamoras/Port Jervis
Future / Actual / Minor
OWP 2.0 WWA Modal Title
01/11/2021, 10:04 PM UTC through 01/11/2021, 10:04 PM UTC
Sender
Sent
Traces and Thresholds Click to turn on/off display
Observed (OBS) 06/11/2025 1:30 PM EDTOfficial Forecast (FCST) 06/11/2025 10:35 AM EDTRecord: 26.6 ftCATEGORY STAGE 
Major Flooding 21.5 ft Moderate Flooding 20 ft Minor Flooding 18 ft Action 16 ft Reliability of the Forecast:
NOTE: Forecasts are issued routinely year-round.
National Water Model Hydrograph
Official NWS streamflow forecasts are produced by NWS hydrologic forecasters for river gauge locations using hydrologic models which are calibrated to that location. This process considers additional guidance and information, including local expertise and experience, to produce the best forecast possible. The NWM output provides supplemental guidance to NWS forecasters and should not be considered an official NWS river forecast.
Flood Impacts
- 26.6 - Record crest from the 1981 ice jam flood. Damage occurred to 950 structures, totalling 14.7 million dollars.
- 23.9 - Flooding overtops the flood walls on the New York and Pennsylvania sides of the river. Widespread flooding occurs with significant damage throughout Port Jervis NY, Matamoras PA, and Montague Township NJ.
- 22 - Low points along flood walls and the river banks are reached in Matamoras which contributes to a considerable amount of inundation in town. Low areas of Port Jervis flood.
Gauge Info
| Coordinates | 41.3706, -74.6978 |
| RFC | MARFC |
| State | PA |
| WFO | BGM |
| County | Pike |
| Data Provider(s) | |
| US Geological Survey | USGS--Water Resources of the United States |
| USGS | 01434000 |
Gauge Location
Recent Crests
| 1. | 21.47 ft | on 06-28-2006 |
| 2. | 20.52 ft | on 04-03-2005 |
| 3. | 19.52 ft | on 09-18-2004 |
| 4. | 18.37 ft | on 01-20-1996 |
| 5. | 26.60 ft | on 02-12-1981 |
Recent Crests
| 1. | 21.47 ft | on 06-28-2006 |
| 2. | 20.52 ft | on 04-03-2005 |
| 3. | 19.52 ft | on 09-18-2004 |
| 4. | 18.37 ft | on 01-20-1996 |
| 5. | 26.60 ft | on 02-12-1981 |
| 6. | 23.91 ft | on 08-19-1955 |
| 7. | 18.50 ft | on 03-07-1923 |
| 8. | 25.50 ft | on 03-08-1904 |
| 9. | 23.10 ft | on 10-10-1903 |
Historic Crests
| 1. | 26.60 ft | on 02-12-1981 |
| 2. | 25.50 ft | on 03-08-1904 |
| 3. | 23.91 ft | on 08-19-1955 |
| 4. | 23.10 ft | on 10-10-1903 |
| 5. | 21.47 ft | on 06-28-2006 |
Historic Crests
| 1. | 26.60 ft | on 02-12-1981 |
| 2. | 25.50 ft | on 03-08-1904 |
| 3. | 23.91 ft | on 08-19-1955 |
| 4. | 23.10 ft | on 10-10-1903 |
| 5. | 21.47 ft | on 06-28-2006 |
| 6. | 20.52 ft | on 04-03-2005 |
| 7. | 19.52 ft | on 09-18-2004 |
| 8. | 18.50 ft | on 03-07-1923 |
| 9. | 18.37 ft | on 01-20-1996 |
Vertical Datum Table
| type | NAVD88 |
|---|---|
| major Flooding | 436.28 ft |
| moderate Flooding | 434.78 ft |
| minor Flooding | 432.78 ft |
| action | 430.78 ft |
| Latest Value | 419.96 ft |
| Gauge Zero | 414.78 ft |
Gauge Photos
No Images Found


Unique Local Info
|
Potential River Levels Used to Estimate the Chance of Flooding and the Range of Possible River Levels |
||
| 10 Day (HEFS) | 10 day (NAEFS) | 10 day (GEFS) |
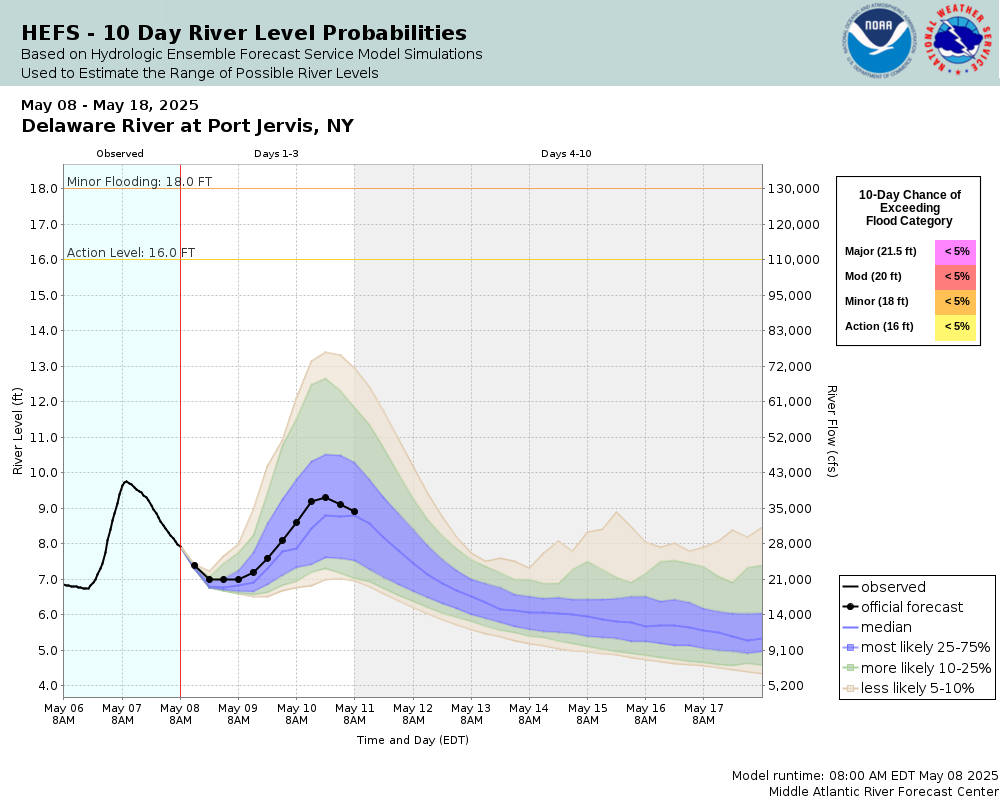 |
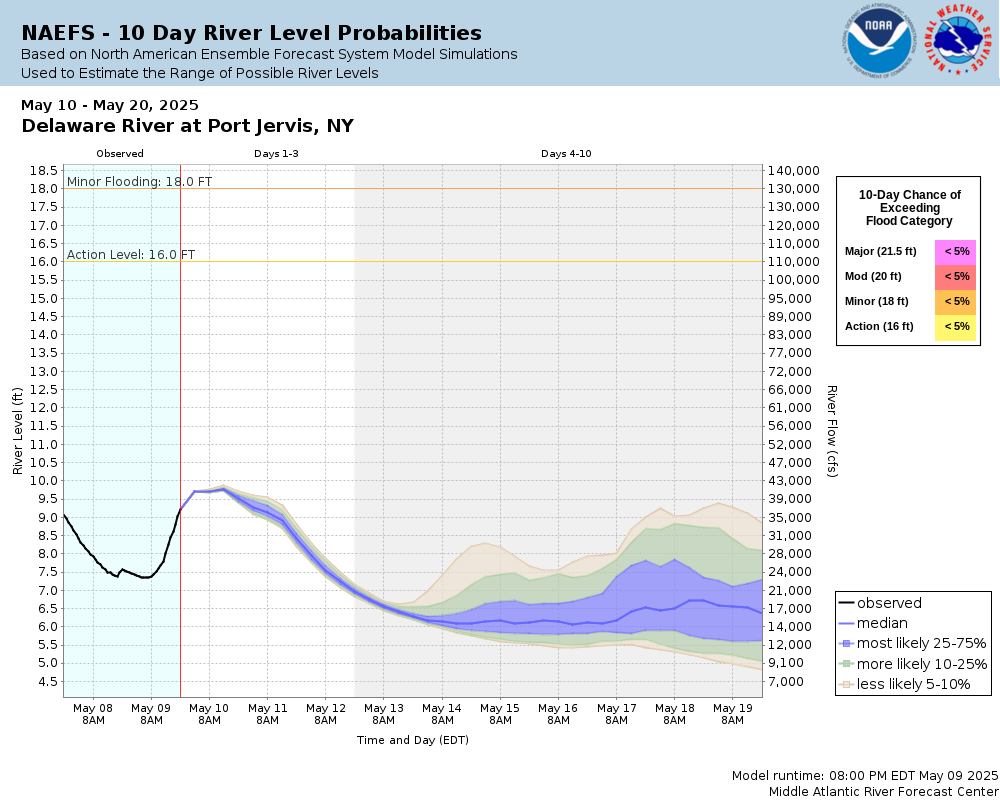 |
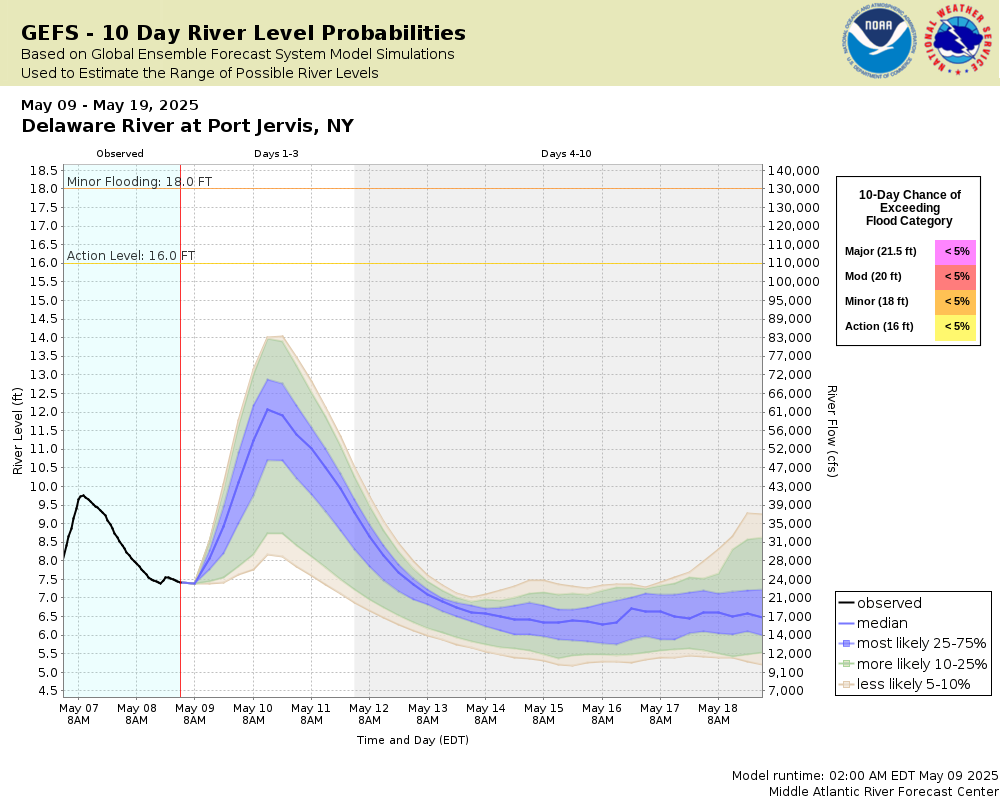 |
Note: Use the official hydrograph at the top of this web page for river levels within the next 72 Hours.
Click individual graphics to enlarge.
Collaborative Agencies
The National Weather Service prepares its forecasts and other services in collaboration with agencies like the US Geological Survey, US Bureau of Reclamation, US Army Corps of Engineers, Natural Resource Conservation Service, National Park Service, ALERT Users Group, Bureau of Indian Affairs, and many state and local emergency managers across the country. For details, please click here.