Redwood Creek near Orick
Future / Actual / Minor
OWP 2.0 WWA Modal Title
01/11/2021, 10:04 PM UTC through 01/11/2021, 10:04 PM UTC
Sender
Sent
- Upstream gauge unavailableDownstream gauge unavailableWarning: no valid ratings curve available. Transformations to and from FEET/CFS/KCFS will not happen.
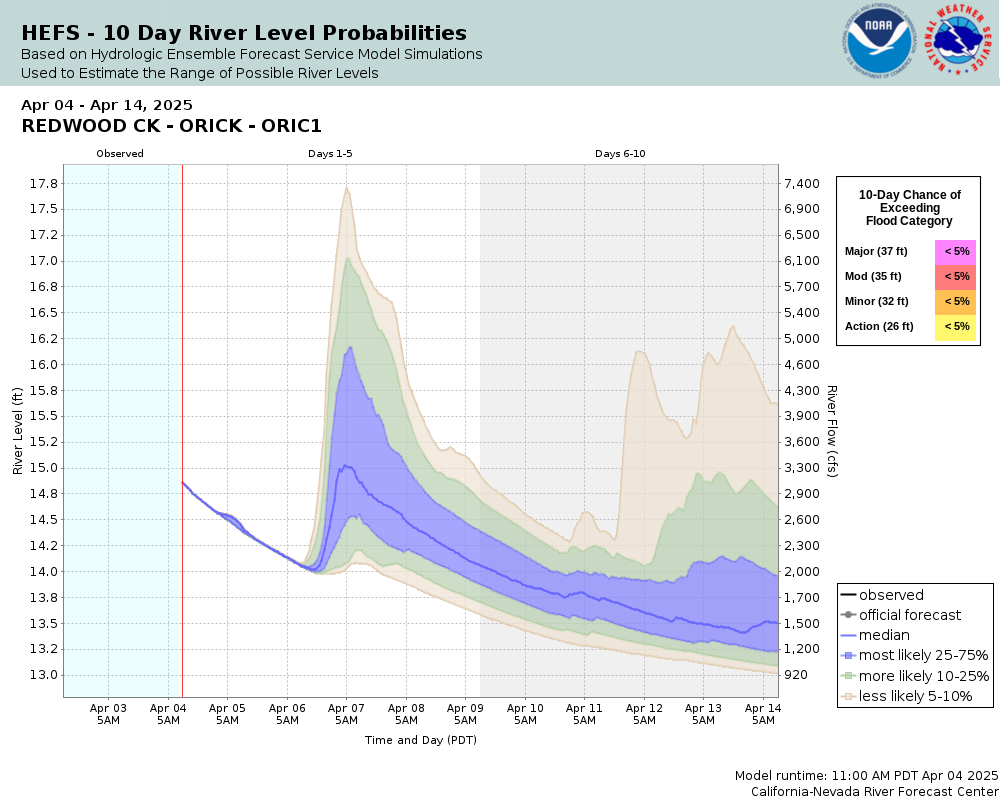
Traces and Thresholds Click to turn on/off display
Observed (OBS) 04/02/2025 2:15 PM PDTOfficial Forecast (FCST) 04/02/2025 1:53 PM PDTRecord: 30.1 ftCATEGORY STAGE 
Major Flooding 37 ft Moderate Flooding 35 ft Minor Flooding 32 ft Action 26 ft Reliability of the Forecast: Based on current and forecast river, weather and reservoir conditions
NOTE: Forecasts are issued routinely year-round.
National Water Model Hydrograph
Official NWS streamflow forecasts are produced by NWS hydrologic forecasters for river gauge locations using hydrologic models which are calibrated to that location. This process considers additional guidance and information, including local expertise and experience, to produce the best forecast possible. The NWM output provides supplemental guidance to NWS forecasters and should not be considered an official NWS river forecast.
Flood Impacts
- 38 - The river level will be overtopping the levee protecting the town of Orick and adjacent areas. The entire delta area from Prairie Creek downstream to the mouth will be innundated. Travel through the area will be severely restricted with numerous road closures, including US Highway 101. All persons in the area should take appropriate action to protect life and property, and move to higher ground as necessary.
- 37 - The river level is at the top of the levee protecting the town of Orick and adjacent areas. Many roads in the delta area may be flooded and impassable including US Highway 101. All persons in the area should take appropriate action and move to higher ground if necessary. High tides and strong onshore winds will amplify effects.
- 36 - The river is within 1 foot of top of levee. Flooding of some roads in the Orick area is likely. Persons living or working in areas protected by the levee should be prepared to take appropriate action and move to higher ground if necessary. High tides and strong, onshore winds amplify effects.
Gauge Info
| Coordinates | 41.2993, -124.051 |
| RFC | CNRFC |
| State | CA |
| WFO | EKA |
| County | Humboldt |
| Data Provider(s) | |
| US Geological Survey | USGS--Water Resources of the United States |
| USGS | 11482500 |
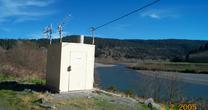
Gauge Location
Recent Crests
| 1. | 30.06 ft | on 01-13-2024 |
| 2. | 23.23 ft | on 12-31-2022 |
| 3. | 18.40 ft | on 02-15-2021 |
| 4. | 18.09 ft | on 01-26-2020 |
| 5. | 22.11 ft | on 02-26-2019 |
Recent Crests
| 1. | 30.06 ft | on 01-13-2024 | |
| 2. | 23.23 ft | on 12-31-2022 | |
| 3. | 18.40 ft | on 02-15-2021 | |
| 4. | 18.09 ft | on 01-26-2020 | |
| 5. | 22.11 ft | on 02-26-2019 | |
| 6. | 19.57 ft | on 01-21-2019 | |
| 7. | 21.05 ft | on 01-11-2017 | |
| 8. | 22.38 ft | on 01-18-2016 | |
| 9. | 20.15 ft | on 12-21-2014 | |
| 10. | 18.05 ft | on 03-10-2014 | |
| 11. | 22.21 ft | on 12-02-2012 | |
| 12. | 20.37 ft | on 03-30-2012 | |
| 13. | 20.68 ft | on 12-29-2010 | |
| 14. | 17.55 ft | on 02-26-2010 | |
| 15. | 25.37 ft | on 01-30-1995 | |
| 16. | 21.48 ft | on 01-09-1995 | |
| 17. | 21.08 ft | on 01-08-1990 | |
| 18. | 22.19 ft | on 11-22-1988 | |
| 19. | 23.82 ft | on 03-18-1975 | |
| 20. | 24.00 ft | on 12-22-1964 | |
| 21. | 21.97 ft | on 01-20-1964 | |
| 22. | 23.95 ft | on 12-22-1955 | 1 |
| 23. | 23.95 ft | on 01-18-1953 |
Historic Crests
| 1. | 30.06 ft | on 01-13-2024 | |
| 2. | 25.37 ft | on 01-30-1995 | |
| 3. | 24.00 ft | on 12-22-1964 | |
| 4. | 23.95 ft | on 12-22-1955 | 1 |
| 5. | 23.95 ft | on 01-18-1953 |
Historic Crests
| 1. | 30.06 ft | on 01-13-2024 | |
| 2. | 25.37 ft | on 01-30-1995 | |
| 3. | 24.00 ft | on 12-22-1964 | |
| 4. | 23.95 ft | on 12-22-1955 | 1 |
| 5. | 23.95 ft | on 01-18-1953 | |
| 6. | 23.82 ft | on 03-18-1975 | |
| 7. | 23.23 ft | on 12-31-2022 | |
| 8. | 22.38 ft | on 01-18-2016 | |
| 9. | 22.21 ft | on 12-02-2012 | |
| 10. | 22.19 ft | on 11-22-1988 | |
| 11. | 22.11 ft | on 02-26-2019 | |
| 12. | 21.97 ft | on 01-20-1964 | |
| 13. | 21.48 ft | on 01-09-1995 | |
| 14. | 21.08 ft | on 01-08-1990 | |
| 15. | 21.05 ft | on 01-11-2017 | |
| 16. | 20.68 ft | on 12-29-2010 | |
| 17. | 20.37 ft | on 03-30-2012 | |
| 18. | 20.15 ft | on 12-21-2014 | |
| 19. | 19.57 ft | on 01-21-2019 | |
| 20. | 18.40 ft | on 02-15-2021 | |
| 21. | 18.09 ft | on 01-26-2020 | |
| 22. | 18.05 ft | on 03-10-2014 | |
| 23. | 17.55 ft | on 02-26-2010 |
Vertical Datum Table
| type | NAVD88 |
|---|---|
| major Flooding | 45.97 ft |
| moderate Flooding | 43.97 ft |
| minor Flooding | 40.97 ft |
| action | 34.97 ft |
| Latest Value | 25.55 ft |
| Gauge Zero | 8.97 ft |


Collaborative Agencies
The National Weather Service prepares its forecasts and other services in collaboration with agencies like the US Geological Survey, US Bureau of Reclamation, US Army Corps of Engineers, Natural Resource Conservation Service, National Park Service, ALERT Users Group, Bureau of Indian Affairs, and many state and local emergency managers across the country. For details, please click here.