Narragansett Bay at Quonset Point (IN MLLW)
Future / Actual / Minor
OWP 2.0 WWA Modal Title
01/11/2021, 10:04 PM UTC through 01/11/2021, 10:04 PM UTC
Sender
Sent
- Upstream gauge unavailableDownstream gauge unavailableWarning: no valid ratings curve available. Transformations to and from FEET/CFS/KCFS will not happen.
Traces and Thresholds Click to turn on/off display
Observed (OBS) 06/14/2025 8:12 PM EDTOfficial Forecast (FCST) 06/14/2025 4:09 PM EDTRecord: 8 ftCATEGORY STAGE 
Major Flooding 9.5 ft Moderate Flooding 7.5 ft Minor Flooding 6 ft Action 5 ft Reliability of the Forecast:
NOTE: Forecasts are issued routinely year-round.
Please refer to our Coastal Hazard Message for specific information regarding Coastal Flood Watches, Warnings and Advisories. Actual impacts from any coastal flooding event may vary due to factors such as rainfall, wave action, and the number of tide cycles during which there is an onshore flow. During tropical cyclones, please refer here for additional storm surge information.
During a Tropical Storm or Hurricane Watch or Warning, inundation mapping provided by the National Hurricane Center (go to the web site and select the storm of interest) reflects a reasonable worst case scenario. The forecast above is the total water forecast that is most likely to occur.
National Water Model Hydrograph
Official NWS streamflow forecasts are produced by NWS hydrologic forecasters for river gauge locations using hydrologic models which are calibrated to that location. This process considers additional guidance and information, including local expertise and experience, to produce the best forecast possible. The NWM output provides supplemental guidance to NWS forecasters and should not be considered an official NWS river forecast.
Flood Impacts
- 10 - Major flooding is expected in the vicinity of North Kingstown, Prudence Island and East Greenwich. Flooding of numerous homes, businesses and roadways are expected. Heed the advice of local officials, and evacuate if asked to do so.
- 9 - Moderate to major coastal flooding is expected in North Kingstown, East Greenwich and Prudence Island. In East Greenwich flooding occurs to some marinas in Greenwich Cove. In North Kingstown, flooding occurs in low lying homes and businesses along Shore Acres and Quonset Point. Flooding occurs along Plum Beach and in nearshore buildings along Plum Point. Inundation of low lying buidings and streets occurs near Wickford Harbor, Wickford Cove and Duck Cove. On Prudence Island, flooding occurs on Neck Farm Rd.
- 8 - In East Greenwich flooding occurs to some marinas in Greenwich Cove. In North Kingstown, flooding occurs in lowest lying homes and businesses along Shore Acres and Quonset Point. Flooding occurs along Plum Beach and in nearshore buildings along Plum Point. Inundation of low lying buildings and streets occurs near Wickford Harbor, Wickford Cove and Duck Cove. On Prudence Island, flooding occurs along portions of Neck Farm Road.
Gauge Info
| Coordinates | 41.5869, -71.4100 |
| RFC | NERFC |
| State | RI |
| WFO | BOX |
| County | Washington |
| Data Provider(s) | |
| NOAA CO-OPS | NOAA Center for Operational Oceanographic Products and Services |
Gauge Location
Recent Crests
| 1. | 6.73 ft | on 03-10-2024 |
| 2. | 6.19 ft | on 02-14-2024 |
| 3. | 6.96 ft | on 01-10-2024 |
| 4. | 15.46 ft | on 12-18-2023 |
| 5. | 7.40 ft | on 12-18-2023 |
Recent Crests
| 1. | 6.73 ft | on 03-10-2024 |
| 2. | 6.19 ft | on 02-14-2024 |
| 3. | 6.96 ft | on 01-10-2024 |
| 4. | 15.46 ft | on 12-18-2023 |
| 5. | 7.40 ft | on 12-18-2023 |
| 6. | 15.58 ft | on 12-18-2023 |
| 7. | 10.70 ft | on 12-11-2023 |
| 8. | 6.03 ft | on 05-17-2022 |
| 9. | 6.22 ft | on 02-02-2021 |
| 10. | 6.00 ft | on 05-09-2020 |
| 11. | 6.16 ft | on 05-08-2020 |
| 12. | 6.05 ft | on 04-09-2020 |
| 13. | 6.04 ft | on 11-27-2018 |
| 14. | 6.20 ft | on 03-02-2018 |
| 15. | 6.25 ft | on 01-04-2018 |
| 16. | 6.71 ft | on 02-09-2016 |
| 17. | 6.58 ft | on 12-27-2012 |
| 18. | 8.02 ft | on 10-29-2012 |
| 19. | 6.84 ft | on 08-28-2011 |
| 20. | 6.66 ft | on 12-03-2009 |
| 21. | 6.98 ft | on 12-12-2008 |
| 22. | 7.30 ft | on 04-16-2007 |
| 23. | 6.88 ft | on 10-28-2006 |
| 24. | 6.56 ft | on 11-06-2002 |
| 25. | 6.11 ft | on 03-07-2001 |
| 26. | 5.08 ft | on 03-06-2001 |
| 27. | 5.21 ft | on 03-06-2001 |
| 28. | 6.64 ft | on 12-12-2000 |
Historic Crests
| 1. | 15.58 ft | on 12-18-2023 |
| 2. | 15.46 ft | on 12-18-2023 |
| 3. | 10.70 ft | on 12-11-2023 |
| 4. | 8.02 ft | on 10-29-2012 |
| 5. | 7.40 ft | on 12-18-2023 |
Historic Crests
| 1. | 15.58 ft | on 12-18-2023 |
| 2. | 15.46 ft | on 12-18-2023 |
| 3. | 10.70 ft | on 12-11-2023 |
| 4. | 8.02 ft | on 10-29-2012 |
| 5. | 7.40 ft | on 12-18-2023 |
| 6. | 7.30 ft | on 04-16-2007 |
| 7. | 6.98 ft | on 12-12-2008 |
| 8. | 6.96 ft | on 01-10-2024 |
| 9. | 6.88 ft | on 10-28-2006 |
| 10. | 6.84 ft | on 08-28-2011 |
| 11. | 6.73 ft | on 03-10-2024 |
| 12. | 6.71 ft | on 02-09-2016 |
| 13. | 6.66 ft | on 12-03-2009 |
| 14. | 6.64 ft | on 12-12-2000 |
| 15. | 6.58 ft | on 12-27-2012 |
| 16. | 6.56 ft | on 11-06-2002 |
| 17. | 6.25 ft | on 01-04-2018 |
| 18. | 6.22 ft | on 02-02-2021 |
| 19. | 6.20 ft | on 03-02-2018 |
| 20. | 6.19 ft | on 02-14-2024 |
| 21. | 6.16 ft | on 05-08-2020 |
| 22. | 6.11 ft | on 03-07-2001 |
| 23. | 6.05 ft | on 04-09-2020 |
| 24. | 6.04 ft | on 11-27-2018 |
| 25. | 6.03 ft | on 05-17-2022 |
| 26. | 6.00 ft | on 05-09-2020 |
| 27. | 5.21 ft | on 03-06-2001 |
| 28. | 5.08 ft | on 03-06-2001 |


Probability Information
No Images Available
Unique Local Info
Quonset Point stage readings and forecasts are in Mean Lower Low Water (MLLW).
|
Potential Tide Levels Used to Estimate the Chance of Flooding and the Range of Possible Tide Levels |
||
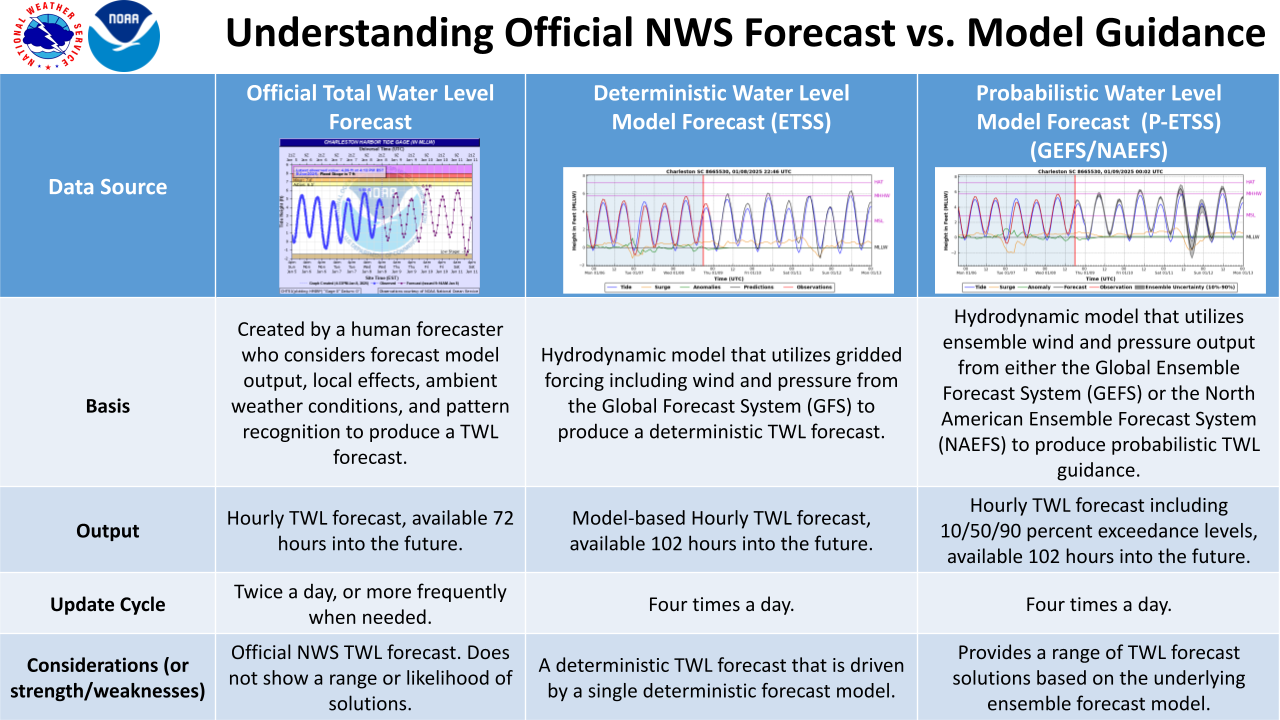
| GFS Based Guidance (ETSS) | GEFS Based Guidance (P-ETSS) | NAEFS Based Guidance (P-ETSS) |
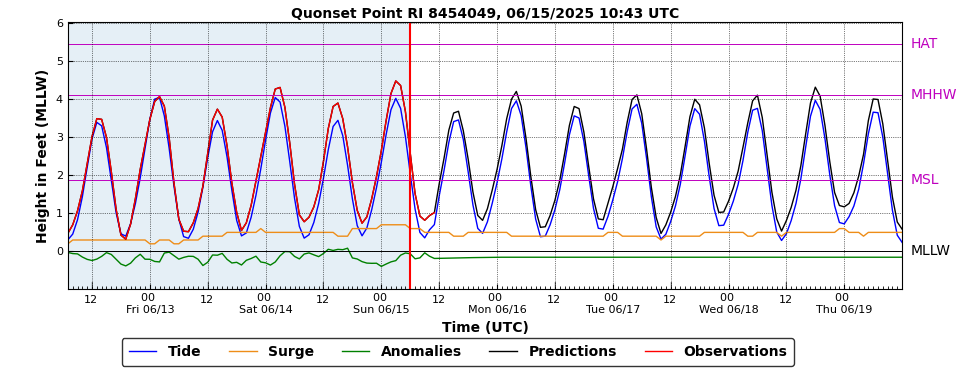 |
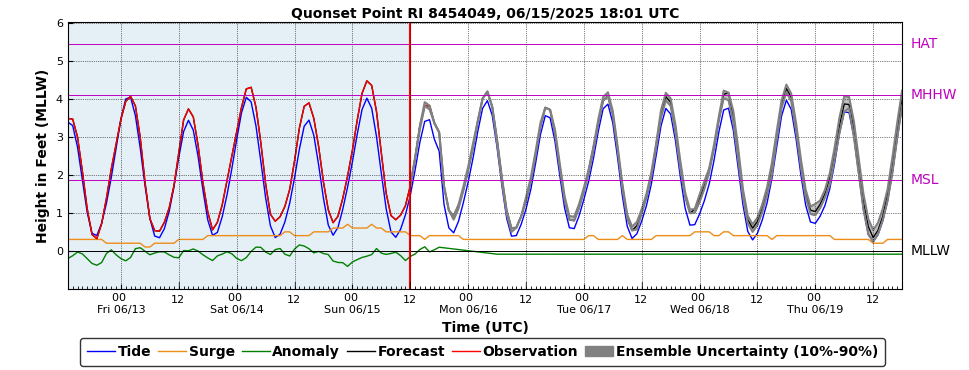 |
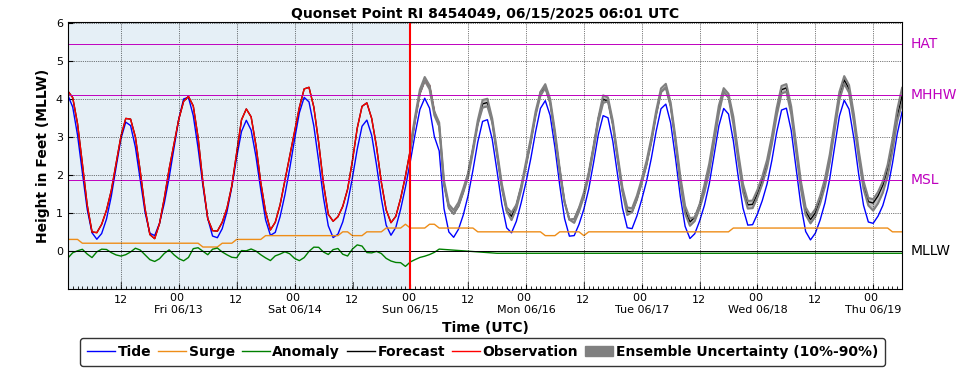 |
Note: Use the official hydrograph at the top of this web page for tide levels within the next 72 hours.
The Potential Tide Level graphics above are from an EXPERIMENTAL web site. It is supported on an 8x5 basis, and has no guarantee of availability in the future. Please see information HERE to understand the strengths and weakness of the Potential Tide Level graphics. Click individual graphics to enlarge.
Collaborative Agencies
The National Weather Service prepares its forecasts and other services in collaboration with agencies like the US Geological Survey, US Bureau of Reclamation, US Army Corps of Engineers, Natural Resource Conservation Service, National Park Service, ALERT Users Group, Bureau of Indian Affairs, and many state and local emergency managers across the country. For details, please click here.