New River at Radford
Future / Actual / Minor
OWP 2.0 WWA Modal Title
01/11/2021, 10:04 PM UTC through 01/11/2021, 10:04 PM UTC
Sender
Sent
- Warning: no valid ratings curve available. Transformations to and from FEET/CFS/KCFS will not happen.
Traces and Thresholds Click to turn on/off display
Observed (OBS) 06/13/2025 4:15 PM EDTOfficial Forecast (FCST) 06/13/2025 10:33 AM EDTRecord: 36 ftCATEGORY STAGE 
Major Flooding 20 ft Moderate Flooding 16 ft Minor Flooding 14 ft Action 12 ft Reliability of the Forecast: Based on current and forecast river, weather and reservoir conditions
NOTE: Forecasts are issued routinely year-round.
River forecasts for this location take into account past precipitation and the precipitation amounts expected approximately 48 hours into the future from the forecast issuance time.
Gauge reading affected by reservoir operations.
National Water Model Hydrograph
Official NWS streamflow forecasts are produced by NWS hydrologic forecasters for river gauge locations using hydrologic models which are calibrated to that location. This process considers additional guidance and information, including local expertise and experience, to produce the best forecast possible. The NWM output provides supplemental guidance to NWS forecasters and should not be considered an official NWS river forecast.
Flood Impacts
- 28 - Green Hill Apartments parking lot floods and Radford University student apartment parking lots are affected.
- 25 - Dedmon Center at Radford University affected.
- 22 - Water approaches the main road in Bissett Park.
Gauge Info
| Coordinates | 37.1417, -80.5694 |
| RFC | OHRFC |
| State | VA |
| WFO | RNK |
| County | Pulaski |
| Data Provider(s) | |
| US Geological Survey | USGS--Water Resources of the United States |
| USGS | 03171000 |
Gauge Location
Recent Crests
| 1. | 31.03 ft | on 09-28-2024 |
| 2. | 10.72 ft | on 01-10-2024 |
| 3. | 8.81 ft | on 05-30-2023 |
| 4. | 17.99 ft | on 11-13-2020 |
| 5. | 21.71 ft | on 05-22-2020 |
Recent Crests
| 1. | 31.03 ft | on 09-28-2024 |
| 2. | 10.72 ft | on 01-10-2024 |
| 3. | 8.81 ft | on 05-30-2023 |
| 4. | 17.99 ft | on 11-13-2020 |
| 5. | 21.71 ft | on 05-22-2020 |
| 6. | 16.48 ft | on 04-14-2020 |
| 7. | 14.74 ft | on 02-07-2020 |
| 8. | 15.79 ft | on 02-24-2019 |
| 9. | 23.83 ft | on 10-12-2018 |
| 10. | 16.30 ft | on 09-18-2018 |
| 11. | 16.78 ft | on 04-24-2017 |
| 12. | 16.16 ft | on 04-20-2015 |
| 13. | 21.13 ft | on 01-31-2013 |
| 14. | 14.36 ft | on 03-07-2011 |
| 15. | 11.62 ft | on 03-13-2010 |
| 16. | 11.92 ft | on 01-25-2010 |
| 17. | 6.50 ft | on 11-16-2007 |
| 18. | 10.87 ft | on 06-28-2006 |
| 19. | 9.28 ft | on 03-29-2005 |
| 20. | 14.94 ft | on 09-29-2004 |
| 21. | 19.77 ft | on 11-20-2003 |
| 22. | 15.08 ft | on 02-23-2003 |
| 23. | 10.25 ft | on 03-18-2002 |
| 24. | 7.73 ft | on 07-30-2001 |
| 25. | 5.13 ft | on 04-18-2000 |
| 26. | 12.89 ft | on 04-20-1998 |
| 27. | 10.50 ft | on 12-02-1996 |
| 28. | 19.81 ft | on 01-19-1996 |
| 29. | 24.04 ft | on 01-15-1995 |
| 30. | 16.12 ft | on 08-18-1994 |
| 31. | 18.24 ft | on 03-24-1993 |
| 32. | 18.81 ft | on 06-05-1992 |
| 33. | 8.16 ft | on 03-30-1991 |
| 34. | 11.79 ft | on 11-16-1989 |
| 35. | 21.73 ft | on 09-23-1989 |
| 36. | 15.12 ft | on 03-01-1987 |
| 37. | 13.60 ft | on 11-05-1985 |
| 38. | 13.79 ft | on 04-10-1983 |
| 39. | 12.15 ft | on 02-03-1982 |
| 40. | 12.42 ft | on 04-15-1980 |
| 41. | 15.23 ft | on 09-22-1979 |
| 42. | 24.10 ft | on 11-07-1977 |
| 43. | 16.46 ft | on 04-05-1977 |
| 44. | 14.26 ft | on 06-21-1976 |
| 45. | 20.02 ft | on 05-28-1973 |
| 46. | 20.21 ft | on 06-21-1972 |
| 47. | 7.58 ft | on 10-20-1968 |
| 48. | 15.57 ft | on 02-14-1966 |
| 49. | 13.95 ft | on 05-12-1961 |
| 50. | 18.64 ft | on 10-01-1959 |
| 51. | 15.33 ft | on 04-06-1957 |
| 52. | 16.86 ft | on 12-08-1950 |
| 53. | 17.00 ft | on 09-18-1945 |
| 54. | 35.96 ft | on 08-14-1940 |
Historic Crests
| 1. | 35.96 ft | on 08-14-1940 |
| 2. | 31.03 ft | on 09-28-2024 |
| 3. | 24.10 ft | on 11-07-1977 |
| 4. | 24.04 ft | on 01-15-1995 |
| 5. | 23.83 ft | on 10-12-2018 |
Historic Crests
| 1. | 35.96 ft | on 08-14-1940 |
| 2. | 31.03 ft | on 09-28-2024 |
| 3. | 24.10 ft | on 11-07-1977 |
| 4. | 24.04 ft | on 01-15-1995 |
| 5. | 23.83 ft | on 10-12-2018 |
| 6. | 21.73 ft | on 09-23-1989 |
| 7. | 21.71 ft | on 05-22-2020 |
| 8. | 21.13 ft | on 01-31-2013 |
| 9. | 20.21 ft | on 06-21-1972 |
| 10. | 20.02 ft | on 05-28-1973 |
| 11. | 19.81 ft | on 01-19-1996 |
| 12. | 19.77 ft | on 11-20-2003 |
| 13. | 18.81 ft | on 06-05-1992 |
| 14. | 18.64 ft | on 10-01-1959 |
| 15. | 18.24 ft | on 03-24-1993 |
| 16. | 17.99 ft | on 11-13-2020 |
| 17. | 17.00 ft | on 09-18-1945 |
| 18. | 16.86 ft | on 12-08-1950 |
| 19. | 16.78 ft | on 04-24-2017 |
| 20. | 16.48 ft | on 04-14-2020 |
| 21. | 16.46 ft | on 04-05-1977 |
| 22. | 16.30 ft | on 09-18-2018 |
| 23. | 16.16 ft | on 04-20-2015 |
| 24. | 16.12 ft | on 08-18-1994 |
| 25. | 15.79 ft | on 02-24-2019 |
| 26. | 15.57 ft | on 02-14-1966 |
| 27. | 15.33 ft | on 04-06-1957 |
| 28. | 15.23 ft | on 09-22-1979 |
| 29. | 15.12 ft | on 03-01-1987 |
| 30. | 15.08 ft | on 02-23-2003 |
| 31. | 14.94 ft | on 09-29-2004 |
| 32. | 14.74 ft | on 02-07-2020 |
| 33. | 14.36 ft | on 03-07-2011 |
| 34. | 14.26 ft | on 06-21-1976 |
| 35. | 13.95 ft | on 05-12-1961 |
| 36. | 13.79 ft | on 04-10-1983 |
| 37. | 13.60 ft | on 11-05-1985 |
| 38. | 12.89 ft | on 04-20-1998 |
| 39. | 12.42 ft | on 04-15-1980 |
| 40. | 12.15 ft | on 02-03-1982 |
| 41. | 11.92 ft | on 01-25-2010 |
| 42. | 11.79 ft | on 11-16-1989 |
| 43. | 11.62 ft | on 03-13-2010 |
| 44. | 10.87 ft | on 06-28-2006 |
| 45. | 10.72 ft | on 01-10-2024 |
| 46. | 10.50 ft | on 12-02-1996 |
| 47. | 10.25 ft | on 03-18-2002 |
| 48. | 9.28 ft | on 03-29-2005 |
| 49. | 8.81 ft | on 05-30-2023 |
| 50. | 8.16 ft | on 03-30-1991 |
| 51. | 7.73 ft | on 07-30-2001 |
| 52. | 7.58 ft | on 10-20-1968 |
| 53. | 6.50 ft | on 11-16-2007 |
| 54. | 5.13 ft | on 04-18-2000 |


Unique Local Info
|
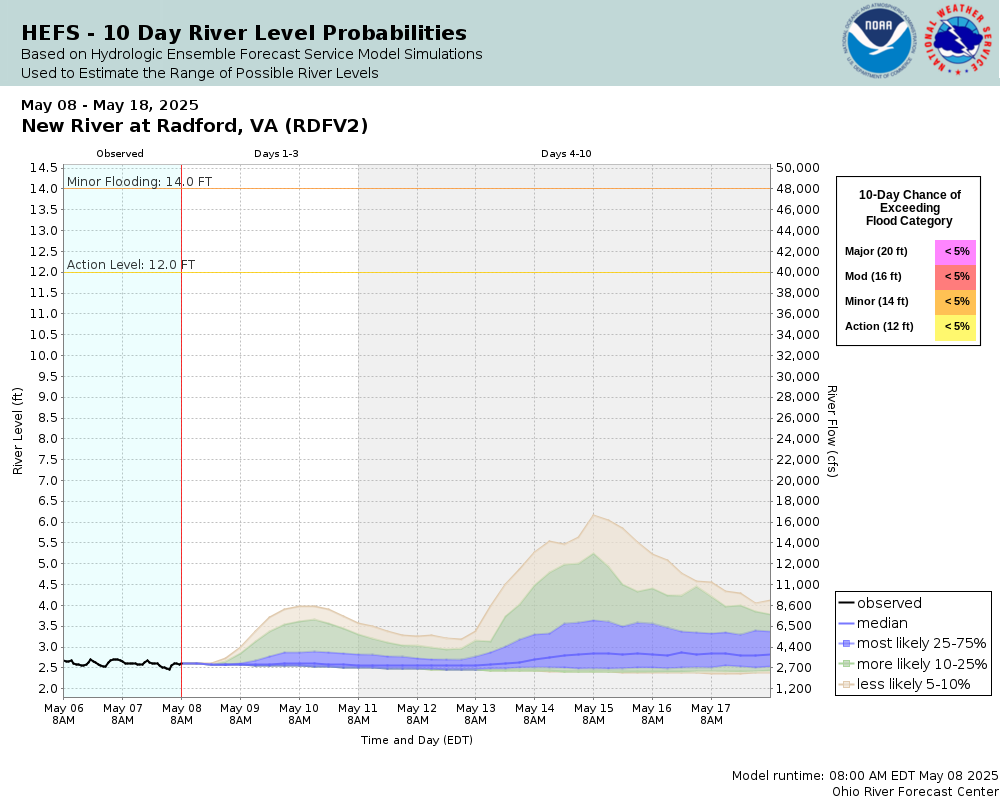
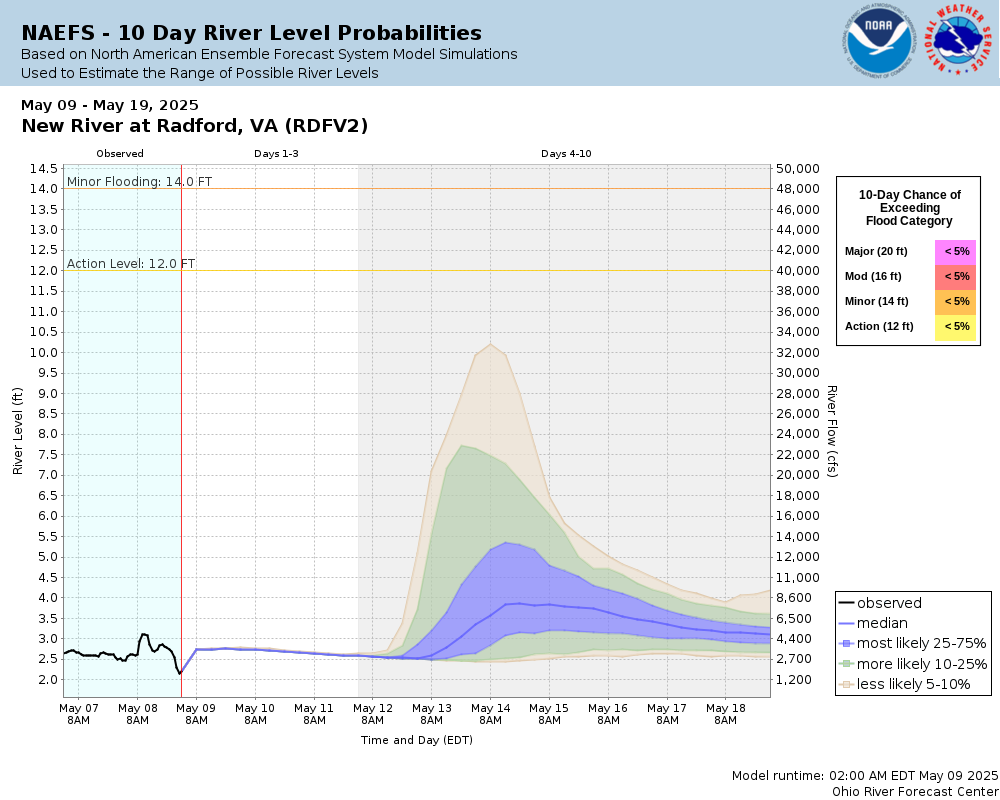
Potential River Levels Used to Estimate the Chance of Flooding and the Range of Possible River Levels |
||
| 10 Day (HEFS) | 10 Day (NAEFS) | 10 Day (GEFS) |
 |
 |
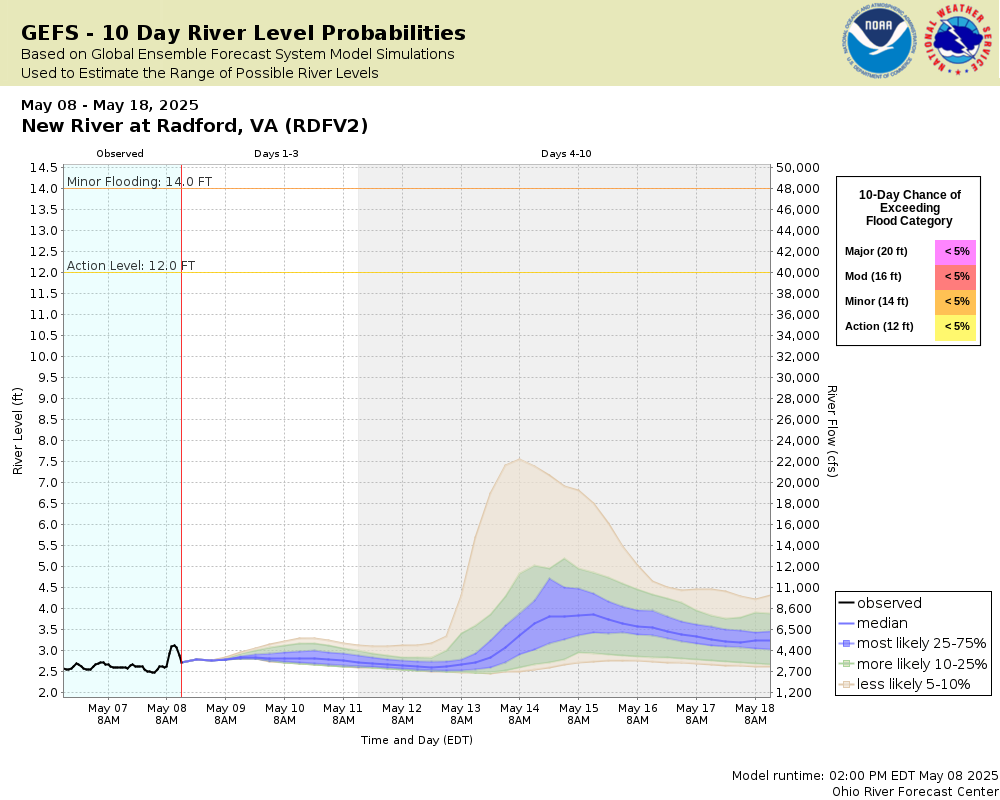 |
Note: Use the official hydrograph at the top of this web page for river levels within the next 48 hours.
Click individual graphics to enlarge.
Collaborative Agencies
The National Weather Service prepares its forecasts and other services in collaboration with agencies like the US Geological Survey, US Bureau of Reclamation, US Army Corps of Engineers, Natural Resource Conservation Service, National Park Service, ALERT Users Group, Bureau of Indian Affairs, and many state and local emergency managers across the country. For details, please click here.