Delaware River at Riegelsville
Future / Actual / Minor
OWP 2.0 WWA Modal Title
01/11/2021, 10:04 PM UTC through 01/11/2021, 10:04 PM UTC
Sender
Sent
- Warning: no valid ratings curve available. Transformations to and from FEET/CFS/KCFS will not happen.
Traces and Thresholds Click to turn on/off display
Observed (OBS) 05/25/2025 9:30 AM EDTOfficial Forecast (FCST) 05/25/2025 9:19 AM EDTRecord: 38.9 ftLow Threshold: 0 ftCATEGORY STAGE 
Major Flooding 30 ft Moderate Flooding 26 ft Minor Flooding 22 ft Action 15 ft Reliability of the Forecast:
NOTE: Forecasts are issued routinely year-round.
National Water Model Hydrograph
Official NWS streamflow forecasts are produced by NWS hydrologic forecasters for river gauge locations using hydrologic models which are calibrated to that location. This process considers additional guidance and information, including local expertise and experience, to produce the best forecast possible. The NWM output provides supplemental guidance to NWS forecasters and should not be considered an official NWS river forecast.
Flood Impacts
- 30 - The town of Reigelsville, Pennsylvania begins to flood.
- 26 - River Road in Carpentersville is flooded and is subject to closures. Street flooding begins in Riegelsville at the intersection of PA Route 611 and Sycamore Road.
- 22 - Pohatcong Creek floods Creek Road due to high and backwater from the Delaware River. The Musconetcong River also floods Mount Joy Road due to high and backwater from the Delaware River.
Gauge Info
| Coordinates | 40.5947, -75.1897 |
| RFC | MARFC |
| State | NJ |
| WFO | PHI |
| County | Hunterdon |
| Data Provider(s) | |
| US Geological Survey | USGS--Water Resources of the United States |
| USGS | 01457500 |
Gauge Location
Recent Crests
| 1. | 22.57 ft | on 04-09-2022 |
| 2. | 24.92 ft | on 09-02-2021 |
| 3. | 28.06 ft | on 09-09-2011 |
| 4. | 24.51 ft | on 08-29-2011 |
| 5. | 25.20 ft | on 03-12-2011 |
Recent Crests
| 1. | 22.57 ft | on 04-09-2022 |
| 2. | 24.92 ft | on 09-02-2021 |
| 3. | 28.06 ft | on 09-09-2011 |
| 4. | 24.51 ft | on 08-29-2011 |
| 5. | 25.20 ft | on 03-12-2011 |
| 6. | 22.35 ft | on 03-08-2011 |
| 7. | 20.33 ft | on 10-02-2010 |
| 8. | 33.62 ft | on 06-29-2006 |
| 9. | 34.07 ft | on 04-03-2005 |
| 10. | 30.95 ft | on 09-19-2004 |
| 11. | 18.35 ft | on 10-30-2003 |
| 12. | 22.38 ft | on 01-28-1996 |
| 13. | 28.72 ft | on 01-20-1996 |
| 14. | 17.66 ft | on 04-15-1994 |
| 15. | 21.66 ft | on 04-02-1993 |
| 16. | 25.16 ft | on 03-16-1986 |
| 17. | 24.46 ft | on 05-30-1984 |
| 18. | 24.17 ft | on 04-17-1983 |
| 19. | 22.55 ft | on 12-22-1973 |
| 20. | 24.36 ft | on 06-30-1973 |
| 21. | 20.19 ft | on 06-23-1972 |
| 22. | 23.80 ft | on 10-16-1955 |
| 23. | 38.85 ft | on 08-20-1955 |
| 24. | 25.40 ft | on 12-12-1952 |
| 25. | 27.50 ft | on 05-24-1942 |
| 26. | 26.47 ft | on 04-01-1940 |
| 27. | 32.45 ft | on 03-19-1936 |
| 28. | 25.00 ft | on 03-28-1913 |
| 29. | 35.90 ft | on 10-10-1903 |
Historic Crests
| 1. | 38.85 ft | on 08-20-1955 |
| 2. | 35.90 ft | on 10-10-1903 |
| 3. | 34.07 ft | on 04-03-2005 |
| 4. | 33.62 ft | on 06-29-2006 |
| 5. | 32.45 ft | on 03-19-1936 |
Historic Crests
| 1. | 38.85 ft | on 08-20-1955 |
| 2. | 35.90 ft | on 10-10-1903 |
| 3. | 34.07 ft | on 04-03-2005 |
| 4. | 33.62 ft | on 06-29-2006 |
| 5. | 32.45 ft | on 03-19-1936 |
| 6. | 30.95 ft | on 09-19-2004 |
| 7. | 28.72 ft | on 01-20-1996 |
| 8. | 28.06 ft | on 09-09-2011 |
| 9. | 27.50 ft | on 05-24-1942 |
| 10. | 26.47 ft | on 04-01-1940 |
| 11. | 25.40 ft | on 12-12-1952 |
| 12. | 25.20 ft | on 03-12-2011 |
| 13. | 25.16 ft | on 03-16-1986 |
| 14. | 25.00 ft | on 03-28-1913 |
| 15. | 24.92 ft | on 09-02-2021 |
| 16. | 24.51 ft | on 08-29-2011 |
| 17. | 24.46 ft | on 05-30-1984 |
| 18. | 24.36 ft | on 06-30-1973 |
| 19. | 24.17 ft | on 04-17-1983 |
| 20. | 23.80 ft | on 10-16-1955 |
| 21. | 22.57 ft | on 04-09-2022 |
| 22. | 22.55 ft | on 12-22-1973 |
| 23. | 22.38 ft | on 01-28-1996 |
| 24. | 22.35 ft | on 03-08-2011 |
| 25. | 21.66 ft | on 04-02-1993 |
| 26. | 20.33 ft | on 10-02-2010 |
| 27. | 20.19 ft | on 06-23-1972 |
| 28. | 18.35 ft | on 10-30-2003 |
| 29. | 17.66 ft | on 04-15-1994 |
Vertical Datum Table
| type | NGVD29 |
|---|---|
| major Flooding | 155.12 ft |
| moderate Flooding | 151.12 ft |
| minor Flooding | 147.12 ft |
| action | 140.12 ft |
| Latest Value | 132.44 ft |
| Gauge Zero | 125.12 ft |
Gauge Photos
No Images Found


Unique Local Info
|
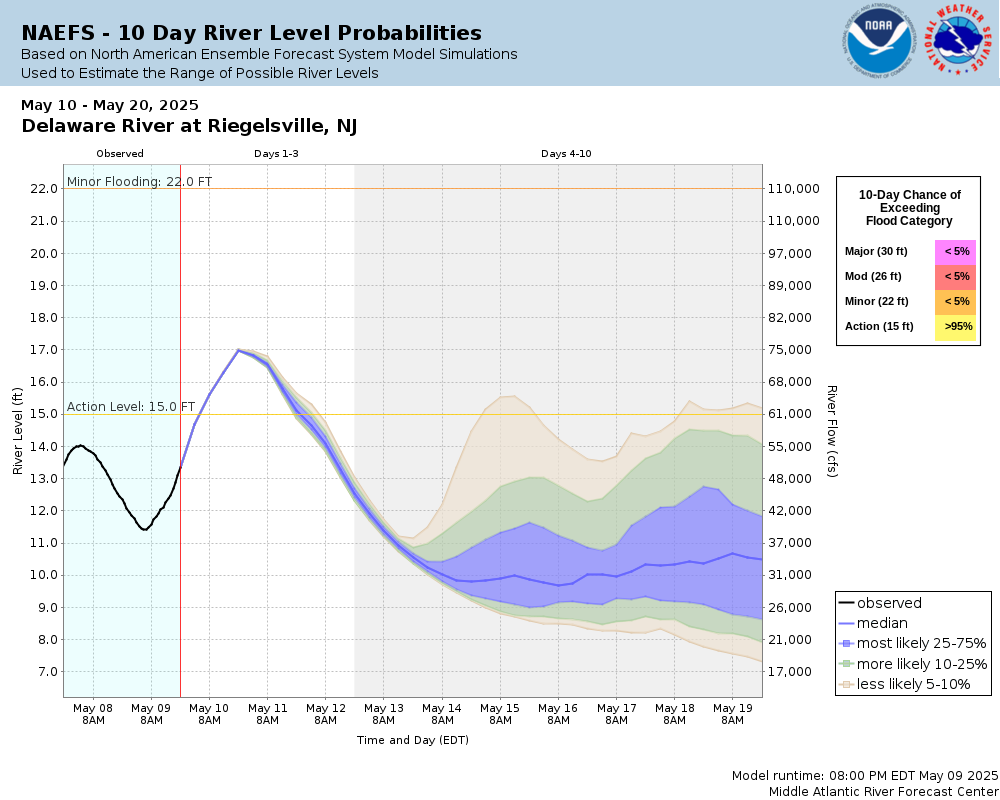
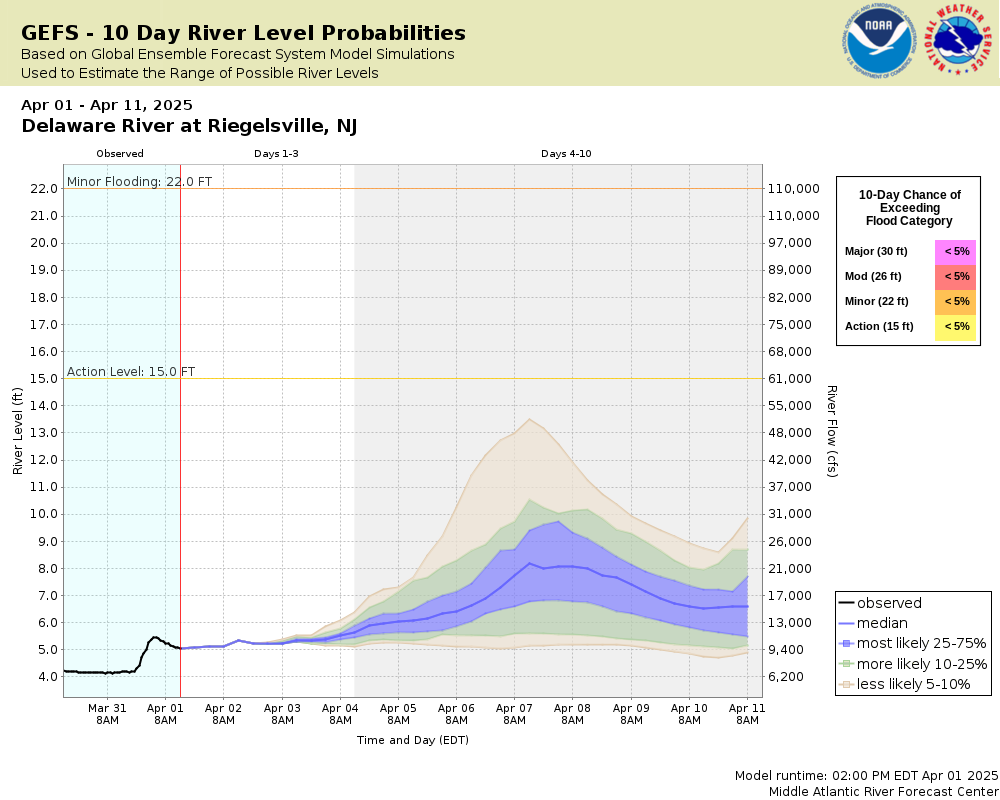
Potential River Levels Used to Estimate the Chance of Flooding and the Range of Possible River Levels |
||
| 10 Day (HEFS) | 10 Day (NAEFS) | 10 Day (GEFS) |
 |
 |
 |
Note: Use the official hydrograph at the top of this web page for river levels within the next 72 hours.
Click individual graphics to enlarge.
During winter months, cold and ice may result in inaccurate real-time stream stage and streamflow data. Adjustments or deletions of this data can only be done after detailed analysis.Collaborative Agencies
The National Weather Service prepares its forecasts and other services in collaboration with agencies like the US Geological Survey, US Bureau of Reclamation, US Army Corps of Engineers, Natural Resource Conservation Service, National Park Service, ALERT Users Group, Bureau of Indian Affairs, and many state and local emergency managers across the country. For details, please click here.