Connecticut River at Springfield
Future / Actual / Minor
OWP 2.0 WWA Modal Title
01/11/2021, 10:04 PM UTC through 01/11/2021, 10:04 PM UTC
Sender
Sent
- Warning: no valid ratings curve available. Transformations to and from FEET/CFS/KCFS will not happen.
Traces and Thresholds Click to turn on/off display
Observed (OBS) 06/11/2025 5:00 AM EDTOfficial Forecast (FCST) 06/10/2025 11:57 AM EDTRecord: 28.6 ftCATEGORY STAGE 
Major Flooding 24 ft Moderate Flooding 22 ft Minor Flooding 20 ft Action 18 ft Reliability of the Forecast:
NOTE: Forecasts are issued routinely year-round.
Stage measured manually and reported by river observer. No automated gauge on-site.
National Water Model Hydrograph
Official NWS streamflow forecasts are produced by NWS hydrologic forecasters for river gauge locations using hydrologic models which are calibrated to that location. This process considers additional guidance and information, including local expertise and experience, to produce the best forecast possible. The NWM output provides supplemental guidance to NWS forecasters and should not be considered an official NWS river forecast.
Flood Impacts
- 24 - This is a serious flood situation. Action must be taken now to protect life and property. Follow the directions provided by your local emergency management officials. Flooding in Chicopee is likely, outside those areas protected by the levees as well as through Springfield and West Springfield.
- 21 - Flooding of low lying sections of West Springfield and Springfield outside of levee protection is expected. Flooding also occurs in lowest lying areas adjacent to the river in Longmeadow and Agawam.
- 20 - Lowland flooding in the Market Gardens and Riverdale sections of West Springfield is expected.
Gauge Location
Recent Crests
| 1. | 17.58 ft | on 08-30-2011 |
| 2. | 17.00 ft | on 10-10-2005 |
| 3. | 14.80 ft | on 04-17-1996 |
| 4. | 8.80 ft | on 01-19-1995 |
| 5. | 22.65 ft | on 06-01-1984 |
Recent Crests
| 1. | 17.58 ft | on 08-30-2011 |
| 2. | 17.00 ft | on 10-10-2005 |
| 3. | 14.80 ft | on 04-17-1996 |
| 4. | 8.80 ft | on 01-19-1995 |
| 5. | 22.65 ft | on 06-01-1984 |
| 6. | 21.10 ft | on 08-19-1955 |
| 7. | 25.75 ft | on 09-23-1938 |
| 8. | 28.60 ft | on 03-20-1936 |
| 9. | 22.45 ft | on 11-06-1927 |
Historic Crests
| 1. | 28.60 ft | on 03-20-1936 |
| 2. | 25.75 ft | on 09-23-1938 |
| 3. | 22.65 ft | on 06-01-1984 |
| 4. | 22.45 ft | on 11-06-1927 |
| 5. | 21.10 ft | on 08-19-1955 |
Historic Crests
| 1. | 28.60 ft | on 03-20-1936 |
| 2. | 25.75 ft | on 09-23-1938 |
| 3. | 22.65 ft | on 06-01-1984 |
| 4. | 22.45 ft | on 11-06-1927 |
| 5. | 21.10 ft | on 08-19-1955 |
| 6. | 17.58 ft | on 08-30-2011 |
| 7. | 17.00 ft | on 10-10-2005 |
| 8. | 14.80 ft | on 04-17-1996 |
| 9. | 8.80 ft | on 01-19-1995 |
Vertical Datum Table
| type | NGVD29 |
|---|---|
| major Flooding | 61.30 ft |
| moderate Flooding | 59.30 ft |
| minor Flooding | 57.30 ft |
| action | 55.30 ft |
| Latest Value | 42.60 ft |
| Gauge Zero | 37.30 ft |
Gauge Photos
No Images Found
Probability Information
No Images Available
Unique Local Info
|
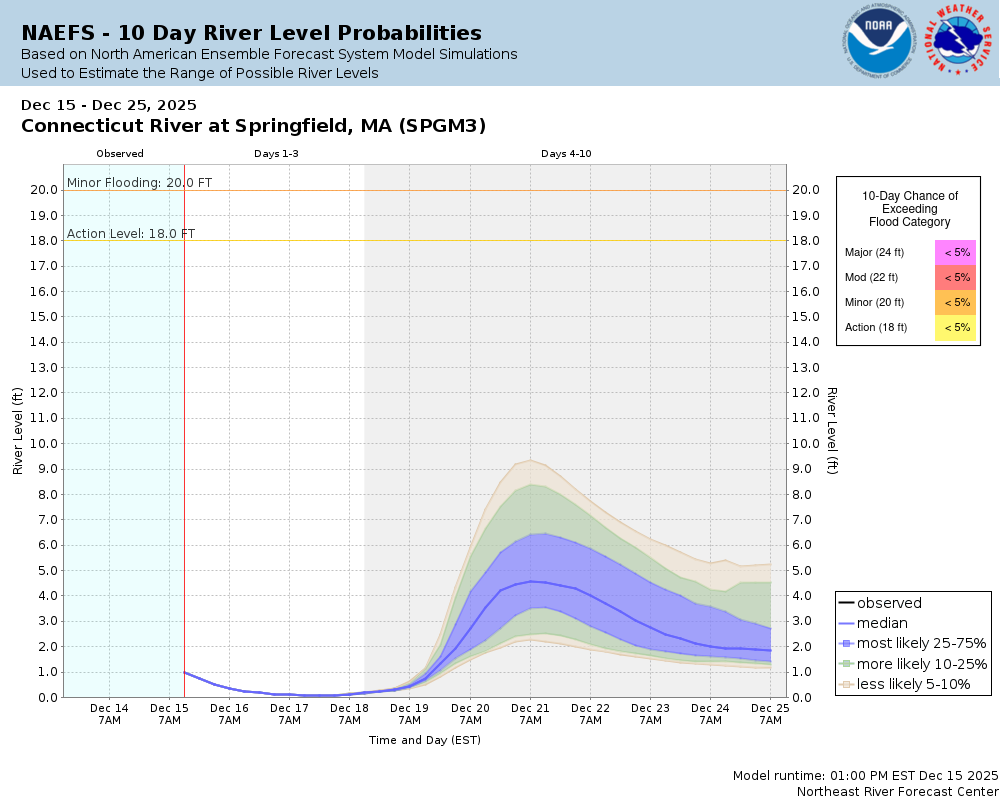
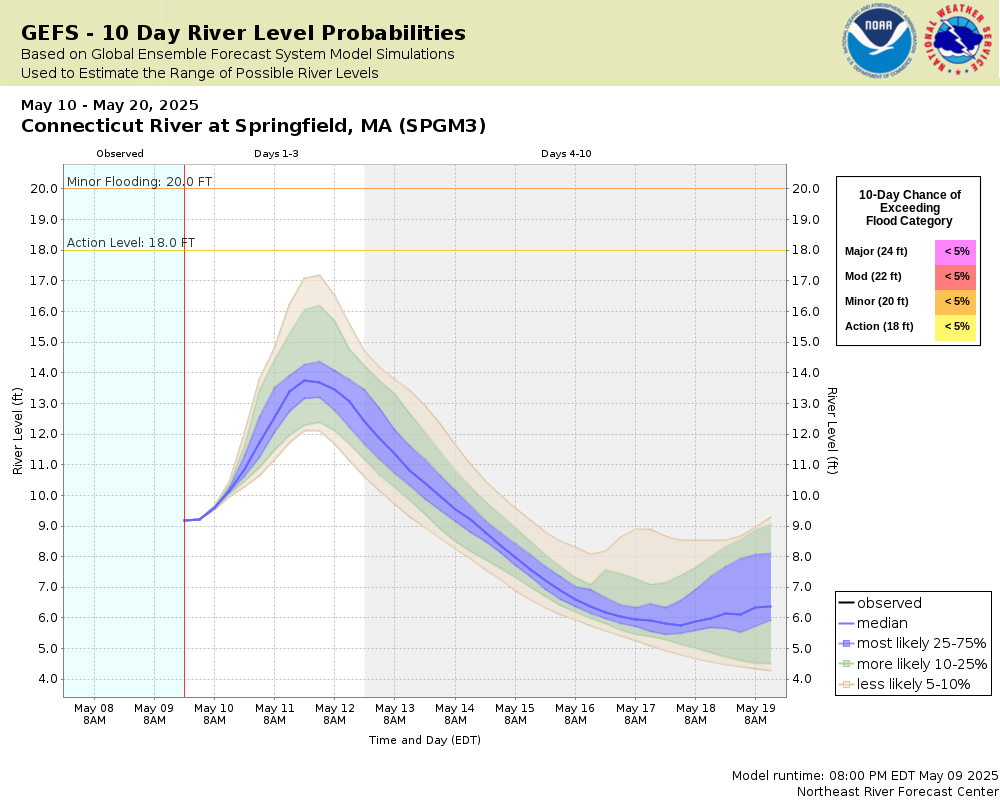
Potential River Levels Used to Estimate the Chance of Flooding and the Range of Possible River Levels |
||
| 10 Day (HEFS) | 10 Day (NAEFS) | 10 Day (GEFS) |
 |
 |
 |
Note: Use the official hydrograph at the top of this web page for river levels within the next 72 hours.
Click individual graphics to enlarge.
River stage data provided by United Water in Springfield MA.Collaborative Agencies
The National Weather Service prepares its forecasts and other services in collaboration with agencies like the US Geological Survey, US Bureau of Reclamation, US Army Corps of Engineers, Natural Resource Conservation Service, National Park Service, ALERT Users Group, Bureau of Indian Affairs, and many state and local emergency managers across the country. For details, please click here.