Chattooga River at Summerville
Future / Actual / Minor
OWP 2.0 WWA Modal Title
01/11/2021, 10:04 PM UTC through 01/11/2021, 10:04 PM UTC
Sender
Sent
- Upstream gauge unavailableDownstream gauge unavailableWarning: no valid ratings curve available. Transformations to and from FEET/CFS/KCFS will not happen.
Traces and Thresholds Click to turn on/off display
Observed (OBS) 06/13/2025 5:45 PM EDTRecord: 22.6 ftCATEGORY STAGE 
Major Flooding 20 ft Moderate Flooding 17 ft Minor Flooding 14 ft Action 12 ft Reliability of the Forecast:
NOTE: Forecasts are issued as needed during times of high water, but are not routinely available.
Automated gauge readings are now available, courtesy of the USGS.
River forecasts for this location take into account past precipitation and the precipitation amounts expected approximately 48 hours into the future from the forecast issuance time.
National Water Model Hydrograph
Official NWS streamflow forecasts are produced by NWS hydrologic forecasters for river gauge locations using hydrologic models which are calibrated to that location. This process considers additional guidance and information, including local expertise and experience, to produce the best forecast possible. The NWM output provides supplemental guidance to NWS forecasters and should not be considered an official NWS river forecast.
Flood Impacts
- 25 - Record flooding never seen before will affect the infrastructure of Summerville. The water level will cover Rome Boulevard and approach The Summerville Times building. In Trion...most of the Mount Vernon Mills buildings...homes on First and Second Streets near the levee...homes and apartments on Park Avenue and Dalton and Cooper Streets are flooded with 5 to 8 feet of water. The water level will top the Dixie Highway bridge. Transportation in and out of the Summerville area will be difficult.
- 23 - Record flooding occurs in sections of Summerville due to tributaries backing up from the high flow on the river. The water level hits the Rome Boulevard bridge and affects The Summerville Times property. In Trion...portions of the Mount Vernon Mills buildings including the personnel office...yards and homes on First and Second Streets near the levee...and athletic fields and other structures off Dalton and Cooper Streets are flooded with 3 to 6 feet of water. The water floods portions of Dixie Highway.
- 22 - Major flooding expands into sections of Summerville due to tributaries backing up from near record high flow on the river. The water reaches the bottom of the Rome Boulevard bridge and affects The Summerville Times property. In Trion...the parking lot and portions of the Mount Vernon Mills buildings including the personnel office...yards and homes on First and Second Streets near the levee...and athletic fields and other structures off Dalton and Cooper Streets are flooded with 2 to 5 feet of water.
Gauge Info
| Coordinates | 34.4664, -85.3361 |
| RFC | SERFC |
| State | GA |
| WFO | FFC |
| County | Chattooga |
| Data Provider(s) | |
| US Geological Survey | USGS--Water Resources of the United States |
| USGS | 02398000 |
Gauge Location
Recent Crests
| 1. | 16.24 ft | on 02-13-2025 |
| 2. | 14.80 ft | on 05-10-2024 |
| 3. | 16.42 ft | on 01-10-2024 |
| 4. | 16.78 ft | on 09-04-2022 |
| 5. | 14.91 ft | on 02-24-2022 |
Recent Crests
| 1. | 16.24 ft | on 02-13-2025 |
| 2. | 14.80 ft | on 05-10-2024 |
| 3. | 16.42 ft | on 01-10-2024 |
| 4. | 16.78 ft | on 09-04-2022 |
| 5. | 14.91 ft | on 02-24-2022 |
| 6. | 14.62 ft | on 09-21-2021 |
| 7. | 15.21 ft | on 04-01-2021 |
| 8. | 18.27 ft | on 03-26-2021 |
| 9. | 16.47 ft | on 03-19-2021 |
| 10. | 21.48 ft | on 04-13-2020 |
| 11. | 14.30 ft | on 03-25-2020 |
| 12. | 19.18 ft | on 02-07-2020 |
| 13. | 14.77 ft | on 02-24-2019 |
| 14. | 16.13 ft | on 02-22-2019 |
| 15. | 14.21 ft | on 01-24-2019 |
| 16. | 14.66 ft | on 01-20-2019 |
| 17. | 14.16 ft | on 12-29-2018 |
| 18. | 14.97 ft | on 12-10-2018 |
| 19. | 15.16 ft | on 01-23-2017 |
| 20. | 16.92 ft | on 02-25-2016 |
| 21. | 15.04 ft | on 02-04-2016 |
| 22. | 14.32 ft | on 12-29-2015 |
| 23. | 20.51 ft | on 12-26-2015 |
| 24. | 15.36 ft | on 12-03-2015 |
| 25. | 15.13 ft | on 04-08-2014 |
| 26. | 17.35 ft | on 05-20-2013 |
| 27. | 15.15 ft | on 05-05-2013 |
| 28. | 14.97 ft | on 04-29-2013 |
| 29. | 16.13 ft | on 01-15-2013 |
| 30. | 15.53 ft | on 11-29-2011 |
| 31. | 17.54 ft | on 03-10-2011 |
| 32. | 14.44 ft | on 03-07-2011 |
| 33. | 14.89 ft | on 02-06-2010 |
| 34. | 15.48 ft | on 01-25-2010 |
| 35. | 18.36 ft | on 12-10-2009 |
| 36. | 21.19 ft | on 09-21-2009 |
| 37. | 16.89 ft | on 01-07-2009 |
| 38. | 22.63 ft | on 02-16-1990 |
| 39. | 19.43 ft | on 03-04-1979 |
| 40. | 19.50 ft | on 03-04-1966 |
| 41. | 21.00 ft | on 03-29-1951 |
| 42. | 20.60 ft | on 11-28-1948 |
Historic Crests
| 1. | 22.63 ft | on 02-16-1990 |
| 2. | 21.48 ft | on 04-13-2020 |
| 3. | 21.19 ft | on 09-21-2009 |
| 4. | 21.00 ft | on 03-29-1951 |
| 5. | 20.60 ft | on 11-28-1948 |
Historic Crests
| 1. | 22.63 ft | on 02-16-1990 |
| 2. | 21.48 ft | on 04-13-2020 |
| 3. | 21.19 ft | on 09-21-2009 |
| 4. | 21.00 ft | on 03-29-1951 |
| 5. | 20.60 ft | on 11-28-1948 |
| 6. | 20.51 ft | on 12-26-2015 |
| 7. | 19.50 ft | on 03-04-1966 |
| 8. | 19.43 ft | on 03-04-1979 |
| 9. | 19.18 ft | on 02-07-2020 |
| 10. | 18.36 ft | on 12-10-2009 |
| 11. | 18.27 ft | on 03-26-2021 |
| 12. | 17.54 ft | on 03-10-2011 |
| 13. | 17.35 ft | on 05-20-2013 |
| 14. | 16.92 ft | on 02-25-2016 |
| 15. | 16.89 ft | on 01-07-2009 |
| 16. | 16.78 ft | on 09-04-2022 |
| 17. | 16.47 ft | on 03-19-2021 |
| 18. | 16.42 ft | on 01-10-2024 |
| 19. | 16.24 ft | on 02-13-2025 |
| 20. | 16.13 ft | on 02-22-2019 |
| 21. | 16.13 ft | on 01-15-2013 |
| 22. | 15.53 ft | on 11-29-2011 |
| 23. | 15.48 ft | on 01-25-2010 |
| 24. | 15.36 ft | on 12-03-2015 |
| 25. | 15.21 ft | on 04-01-2021 |
| 26. | 15.16 ft | on 01-23-2017 |
| 27. | 15.15 ft | on 05-05-2013 |
| 28. | 15.13 ft | on 04-08-2014 |
| 29. | 15.04 ft | on 02-04-2016 |
| 30. | 14.97 ft | on 12-10-2018 |
| 31. | 14.97 ft | on 04-29-2013 |
| 32. | 14.91 ft | on 02-24-2022 |
| 33. | 14.89 ft | on 02-06-2010 |
| 34. | 14.80 ft | on 05-10-2024 |
| 35. | 14.77 ft | on 02-24-2019 |
| 36. | 14.66 ft | on 01-20-2019 |
| 37. | 14.62 ft | on 09-21-2021 |
| 38. | 14.44 ft | on 03-07-2011 |
| 39. | 14.32 ft | on 12-29-2015 |
| 40. | 14.30 ft | on 03-25-2020 |
| 41. | 14.21 ft | on 01-24-2019 |
| 42. | 14.16 ft | on 12-29-2018 |
Vertical Datum Table
| type | NAVD88 | STND |
|---|---|---|
| major Flooding | 633.46 ft | 20.00 ft |
| moderate Flooding | 630.46 ft | 17.00 ft |
| minor Flooding | 627.46 ft | 14.00 ft |
| action | 625.46 ft | 12.00 ft |
| Latest Value | 616.27 ft | 2.81 ft |
| Gauge Zero | 613.46 ft | 0.00 ft |
Gauge Photos
No Images Found


Unique Local Info
|
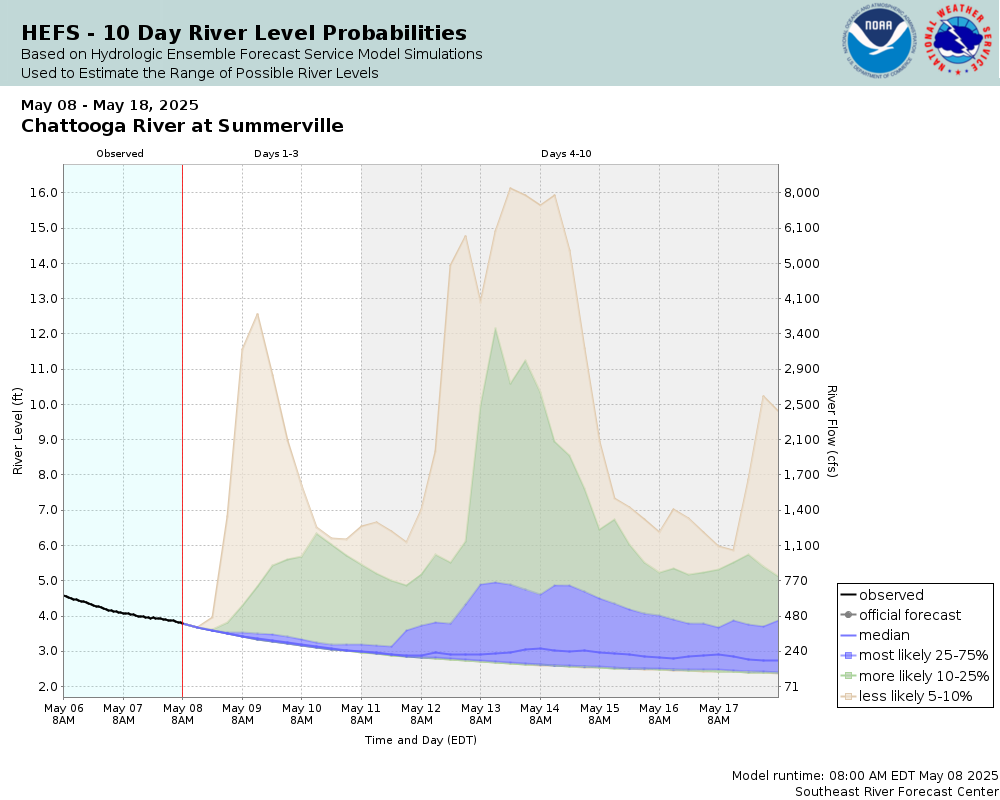
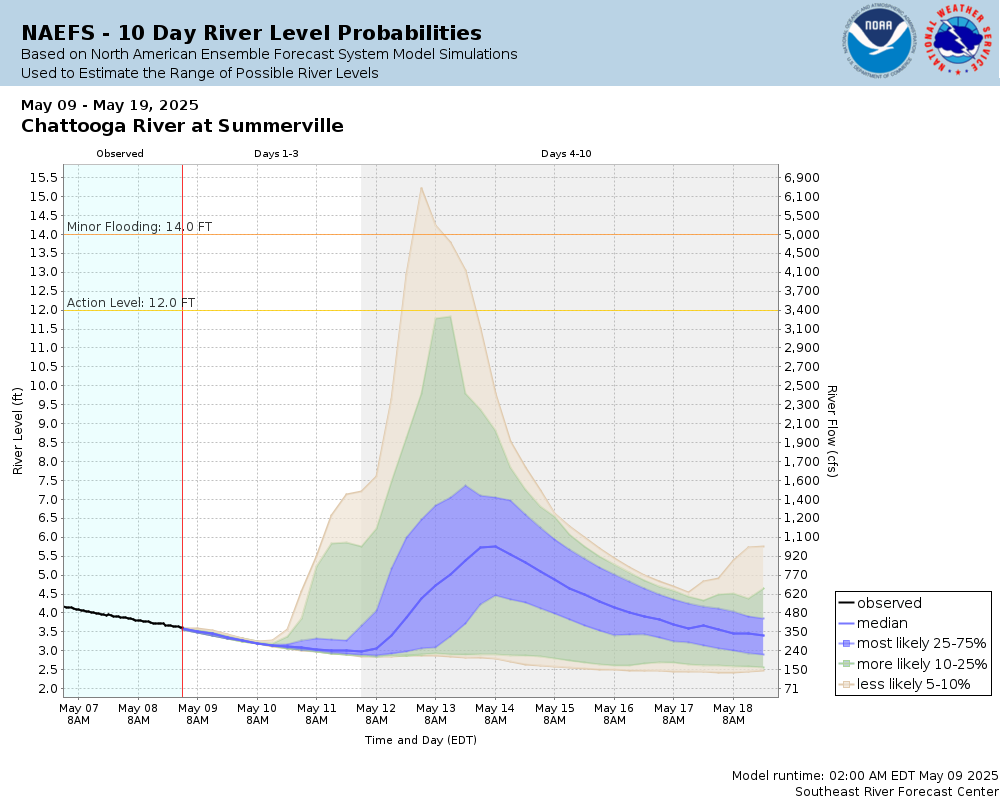
Potential River Levels Used to Estimate the Chance of Flooding and the Range of Possible River Levels |
||
| 10 Day (HEFS) | 7 Day (NAEFS) | 7 Day (GEFS) |
 |
 |
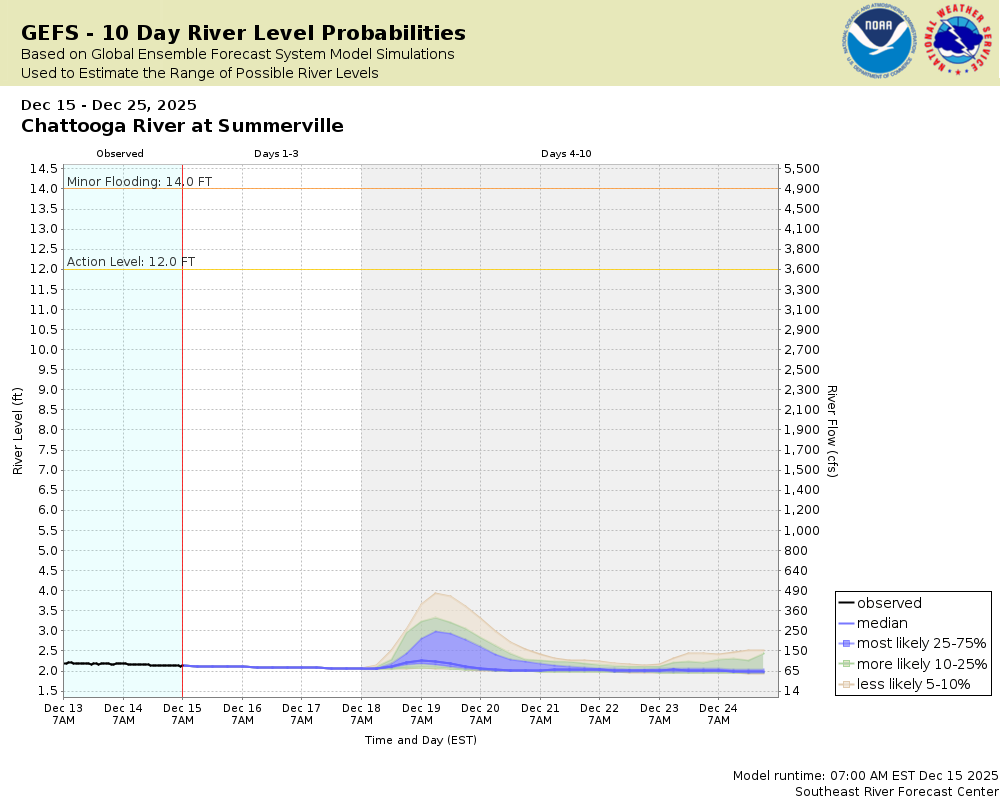 |
Note: Use the official hydrograph at the top of this web page for river levels within the next 72 Hours.
Collaborative Agencies
The National Weather Service prepares its forecasts and other services in collaboration with agencies like the US Geological Survey, US Bureau of Reclamation, US Army Corps of Engineers, Natural Resource Conservation Service, National Park Service, ALERT Users Group, Bureau of Indian Affairs, and many state and local emergency managers across the country. For details, please click here.