Trent River West of Trenton
Future / Actual / Minor
OWP 2.0 WWA Modal Title
01/11/2021, 10:04 PM UTC through 01/11/2021, 10:04 PM UTC
Sender
Sent
- Upstream gauge unavailableWarning: no valid ratings curve available. Transformations to and from FEET/CFS/KCFS will not happen.
Traces and Thresholds Click to turn on/off display
Observed (OBS) 06/28/2025 4:45 AM EDTRecord: 22.3 ftCATEGORY STAGE 
Major Flooding 20 ft Moderate Flooding 17 ft Minor Flooding 14 ft Action 13.5 ft Reliability of the Forecast:
NOTE: Forecasts are issued as needed during times of high water, but are not routinely available.
National Water Model Hydrograph
Official NWS streamflow forecasts are produced by NWS hydrologic forecasters for river gauge locations using hydrologic models which are calibrated to that location. This process considers additional guidance and information, including local expertise and experience, to produce the best forecast possible. The NWM output provides supplemental guidance to NWS forecasters and should not be considered an official NWS river forecast.
Flood Impacts
- 24 - Devastating flooding across western Jones County. Numerous homes inundated by floodwaters, and travel near the river or its tributaries is impossible. This is comparable to the flood from Hurricane Florence.
- 20 - Water threatens Highway 58 bridge west of Trenton. Most roads that cross the river west of Trenton are inundated. Numerous homes and businesses in the town of Trenton are flooded. Many areas west of Trenton inundated. Water threatens homes on and near Planatation Road, with some homes surrounded by floodwaters.
- 17 - Water overflows the Free Bridge on Chinquapin Chapel Road along with several homes on Plantation Road. Water inundates low spots near the bridge on HWY 58 and Chinquapin Chapel Road. Middle Road is flooded north of Thigpen Lane, and some homes on Thigpen Lane are cut off.
Gauge Info
| Coordinates | 35.0642, -77.4614 |
| RFC | SERFC |
| State | NC |
| WFO | MHX |
| County | Jones |
| Data Provider(s) | |
| US Geological Survey | USGS--Water Resources of the United States |
| USGS | 02092500 |
Gauge Location
Recent Crests
| 1. | 15.18 ft | on 09-19-2024 |
| 2. | 16.69 ft | on 08-10-2024 |
| 3. | 15.07 ft | on 07-27-2024 |
| 4. | 15.18 ft | on 11-15-2020 |
| 5. | 24.24 ft | on 09-16-2018 |
Recent Crests
| 1. | 15.18 ft | on 09-19-2024 |
| 2. | 16.69 ft | on 08-10-2024 |
| 3. | 15.07 ft | on 07-27-2024 |
| 4. | 15.18 ft | on 11-15-2020 |
| 5. | 24.24 ft | on 09-16-2018 |
| 6. | 14.30 ft | on 04-27-2017 |
| 7. | 18.48 ft | on 10-10-2016 |
| 8. | 11.41 ft | on 07-16-2013 |
| 9. | 12.69 ft | on 08-27-2012 |
| 10. | 12.25 ft | on 08-31-2011 |
| 11. | 16.22 ft | on 10-02-2010 |
| 12. | 14.25 ft | on 02-08-2010 |
| 13. | 8.82 ft | on 03-05-2009 |
| 14. | 11.91 ft | on 04-08-2008 |
| 15. | 16.64 ft | on 11-24-2006 |
| 16. | 17.66 ft | on 09-03-2006 |
| 17. | 11.96 ft | on 07-03-2005 |
| 18. | 15.12 ft | on 08-17-2004 |
| 19. | 14.70 ft | on 07-16-2003 |
| 20. | 11.74 ft | on 03-06-2002 |
| 21. | 11.68 ft | on 03-24-2001 |
| 22. | 22.33 ft | on 09-17-1999 |
| 23. | 14.76 ft | on 02-20-1998 |
| 24. | 17.84 ft | on 09-21-1995 |
| 25. | 14.19 ft | on 03-04-1994 |
| 26. | 15.40 ft | on 08-19-1992 |
| 27. | 17.30 ft | on 09-01-1928 |
Historic Crests
| 1. | 24.24 ft | on 09-16-2018 |
| 2. | 22.33 ft | on 09-17-1999 |
| 3. | 18.48 ft | on 10-10-2016 |
| 4. | 17.84 ft | on 09-21-1995 |
| 5. | 17.66 ft | on 09-03-2006 |
Historic Crests
| 1. | 24.24 ft | on 09-16-2018 |
| 2. | 22.33 ft | on 09-17-1999 |
| 3. | 18.48 ft | on 10-10-2016 |
| 4. | 17.84 ft | on 09-21-1995 |
| 5. | 17.66 ft | on 09-03-2006 |
| 6. | 17.30 ft | on 09-01-1928 |
| 7. | 16.69 ft | on 08-10-2024 |
| 8. | 16.64 ft | on 11-24-2006 |
| 9. | 16.22 ft | on 10-02-2010 |
| 10. | 15.40 ft | on 08-19-1992 |
| 11. | 15.18 ft | on 11-15-2020 |
| 12. | 15.18 ft | on 09-19-2024 |
| 13. | 15.12 ft | on 08-17-2004 |
| 14. | 15.07 ft | on 07-27-2024 |
| 15. | 14.76 ft | on 02-20-1998 |
| 16. | 14.70 ft | on 07-16-2003 |
| 17. | 14.30 ft | on 04-27-2017 |
| 18. | 14.25 ft | on 02-08-2010 |
| 19. | 14.19 ft | on 03-04-1994 |
| 20. | 12.69 ft | on 08-27-2012 |
| 21. | 12.25 ft | on 08-31-2011 |
| 22. | 11.96 ft | on 07-03-2005 |
| 23. | 11.91 ft | on 04-08-2008 |
| 24. | 11.74 ft | on 03-06-2002 |
| 25. | 11.68 ft | on 03-24-2001 |
| 26. | 11.41 ft | on 07-16-2013 |
| 27. | 8.82 ft | on 03-05-2009 |


Probability Information
No Images Available
Unique Local Info
|
Potential River Levels Used to Estimate the Chance of Flooding and the Range of Possible River Levels |
||
| 10 Day (HEFS) | 10 Day (NAEFS) | 10 Day (GEFS) |
 |
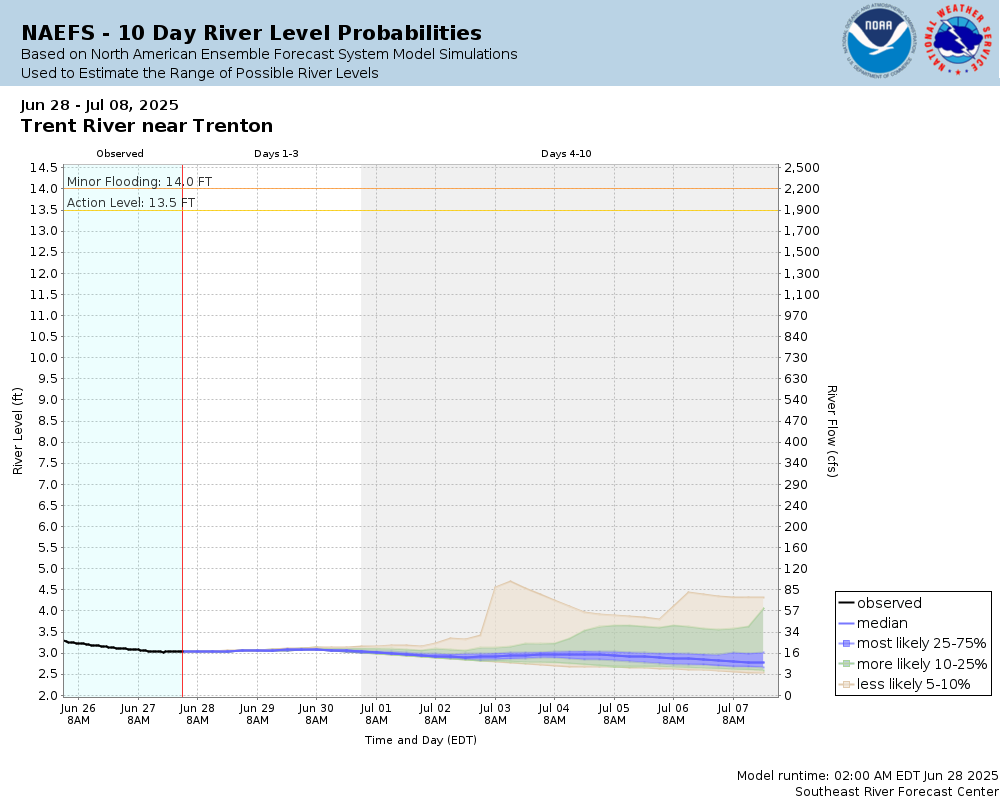 |
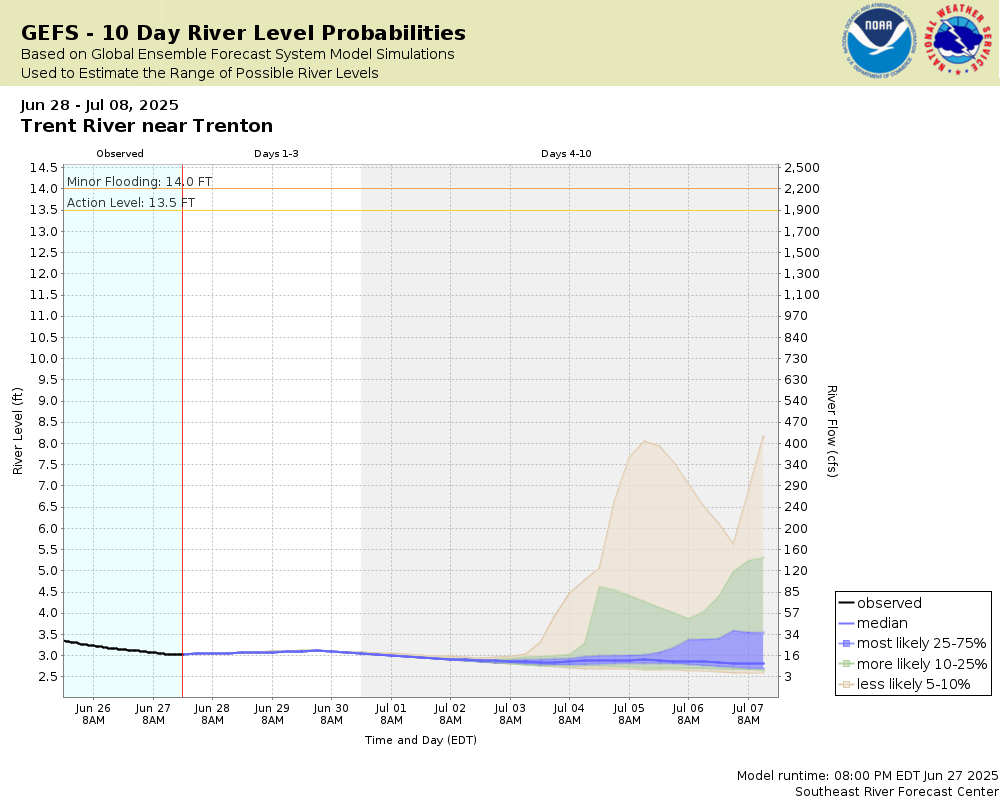 |
Note: Use the official hydrograph at the top of this web page for river levels within the next 72 hours.
Click individual graphics to enlarge.
Collaborative Agencies
The National Weather Service prepares its forecasts and other services in collaboration with agencies like the US Geological Survey, US Bureau of Reclamation, US Army Corps of Engineers, Natural Resource Conservation Service, National Park Service, ALERT Users Group, Bureau of Indian Affairs, and many state and local emergency managers across the country. For details, please click here.