Delaware River at Washington Crossing
Future / Actual / Minor
OWP 2.0 WWA Modal Title
01/11/2021, 10:04 PM UTC through 01/11/2021, 10:04 PM UTC
Sender
Sent
- Warning: no valid ratings curve available. Transformations to and from FEET/CFS/KCFS will not happen.
Traces and Thresholds Click to turn on/off display
Observed (OBS) 06/08/2025 8:00 PM EDTOfficial Forecast (FCST) 06/08/2025 9:20 AM EDTRecord: 27.8 ftCATEGORY STAGE 
Major Flooding 22 ft Moderate Flooding 19 ft Minor Flooding 16 ft Action 12 ft Reliability of the Forecast:
NOTE: Forecasts are issued routinely year-round.
National Water Model Hydrograph
Official NWS streamflow forecasts are produced by NWS hydrologic forecasters for river gauge locations using hydrologic models which are calibrated to that location. This process considers additional guidance and information, including local expertise and experience, to produce the best forecast possible. The NWM output provides supplemental guidance to NWS forecasters and should not be considered an official NWS river forecast.
Flood Impacts
- 22.5 - Route 532 at the Canal bridge in Upper Makefield Township is impassable.
- 16.5 - Flooding begins on Lower River Drive in Washington Crossing State Park. Flooding also occurs on Upper Drive near House #1 in the Titusville section of Hopewell Township.
- 16 - River Road, between Mt. Eyre Road and Gilbert Street, in Upper Makefield Township begins to flood. First floor homes in the area take on water.
Gauge Info
| Coordinates | 40.2944, -74.8694 |
| RFC | MARFC |
| State | NJ |
| WFO | PHI |
| County | Mercer |
| Data Provider(s) | |
| Delaware Joint Toll Bridge Comm. | USGS--Water Resources of the United States |
| USGS | 01462500 |
Gauge Location
Recent Crests
| 1. | 16.91 ft | on 09-02-2021 | |
| 2. | 20.04 ft | on 09-08-2011 | |
| 3. | 16.06 ft | on 08-29-2011 | |
| 4. | 16.41 ft | on 03-12-2011 | |
| 5. | 22.54 ft | on 06-29-2006 | (P) |
Recent Crests
| 1. | 16.91 ft | on 09-02-2021 | |
| 2. | 20.04 ft | on 09-08-2011 | |
| 3. | 16.06 ft | on 08-29-2011 | |
| 4. | 16.41 ft | on 03-12-2011 | |
| 5. | 22.54 ft | on 06-29-2006 | (P) |
| 6. | 23.10 ft | on 04-04-2005 | |
| 7. | 20.20 ft | on 09-19-2004 | |
| 8. | 16.47 ft | on 01-28-1996 | |
| 9. | 18.45 ft | on 01-21-1996 | |
| 10. | 16.17 ft | on 05-30-1984 | |
| 11. | 14.97 ft | on 06-30-1973 | |
| 12. | 14.89 ft | on 10-17-1955 | |
| 13. | 27.77 ft | on 08-20-1955 | |
| 14. | 21.30 ft | on 03-19-1936 | |
| 15. | 20.21 ft | on 03-13-1936 | |
| 16. | 25.90 ft | on 10-11-1903 |
Historic Crests
| 1. | 27.77 ft | on 08-20-1955 | |
| 2. | 25.90 ft | on 10-11-1903 | |
| 3. | 23.10 ft | on 04-04-2005 | |
| 4. | 22.54 ft | on 06-29-2006 | (P) |
| 5. | 21.30 ft | on 03-19-1936 |
Historic Crests
| 1. | 27.77 ft | on 08-20-1955 | |
| 2. | 25.90 ft | on 10-11-1903 | |
| 3. | 23.10 ft | on 04-04-2005 | |
| 4. | 22.54 ft | on 06-29-2006 | (P) |
| 5. | 21.30 ft | on 03-19-1936 | |
| 6. | 20.21 ft | on 03-13-1936 | |
| 7. | 20.20 ft | on 09-19-2004 | |
| 8. | 20.04 ft | on 09-08-2011 | |
| 9. | 18.45 ft | on 01-21-1996 | |
| 10. | 16.91 ft | on 09-02-2021 | |
| 11. | 16.47 ft | on 01-28-1996 | |
| 12. | 16.41 ft | on 03-12-2011 | |
| 13. | 16.17 ft | on 05-30-1984 | |
| 14. | 16.06 ft | on 08-29-2011 | |
| 15. | 14.97 ft | on 06-30-1973 | |
| 16. | 14.89 ft | on 10-17-1955 |
Vertical Datum Table
| type | NGVD29 |
|---|---|
| major Flooding | 48.14 ft |
| moderate Flooding | 45.14 ft |
| minor Flooding | 42.14 ft |
| action | 38.14 ft |
| Latest Value | 27.55 ft |
| Gauge Zero | 26.14 ft |


Unique Local Info
|
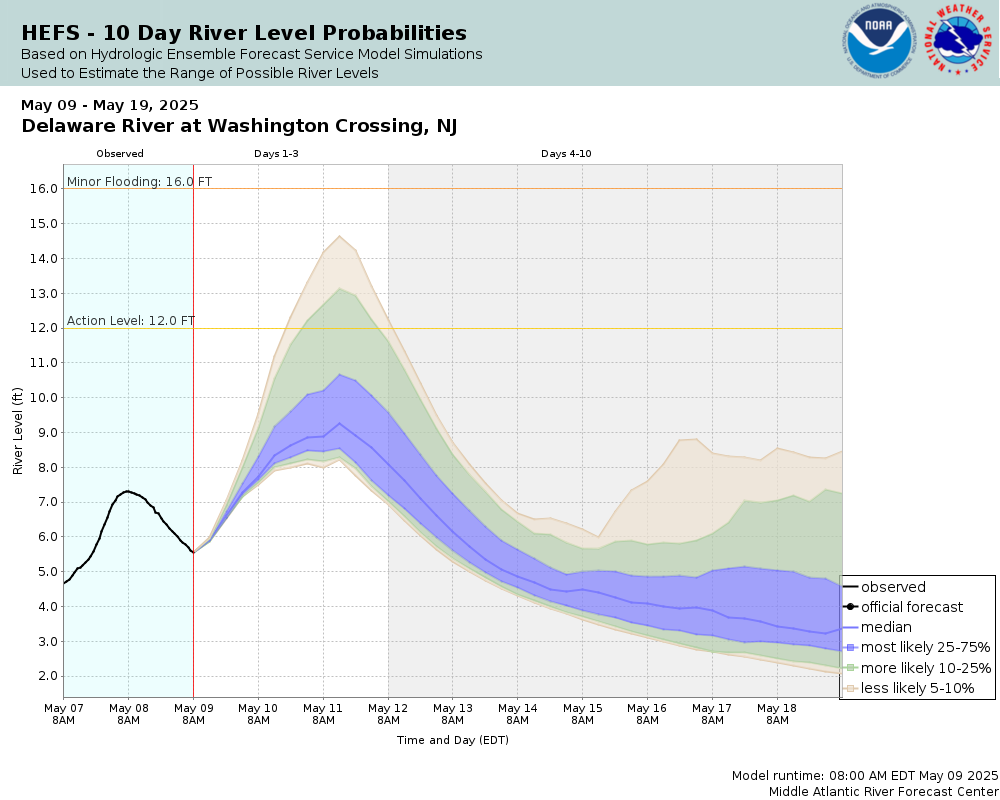
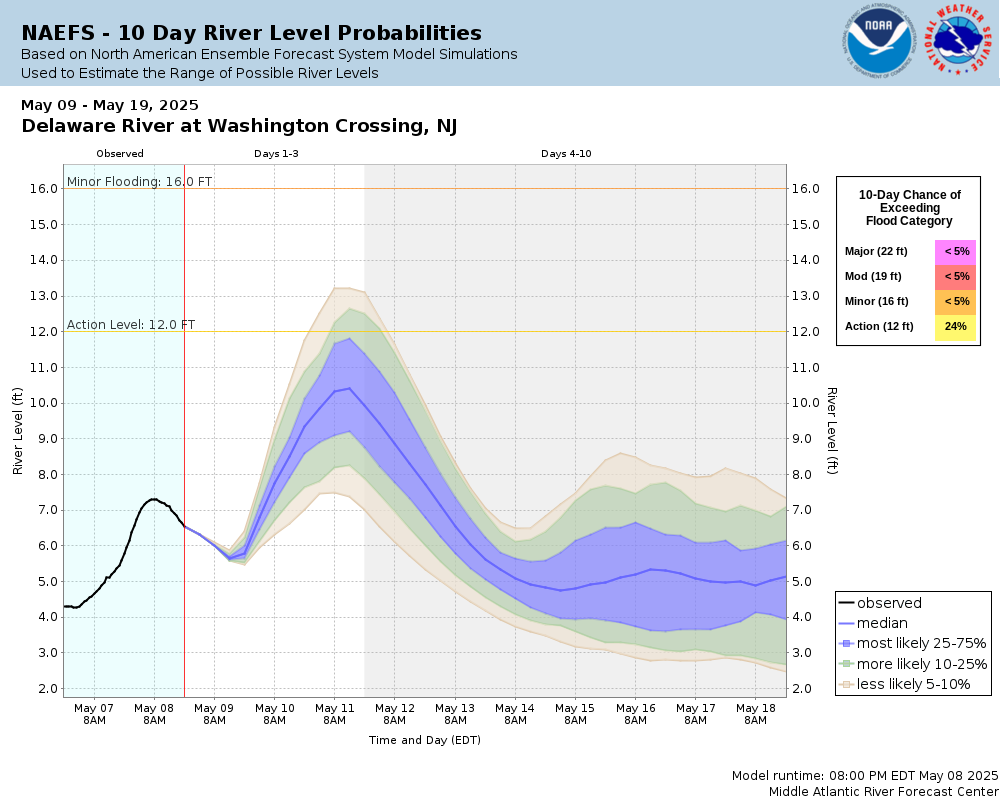
Potential River Levels Used to Estimate the Chance of Flooding and the Range of Possible River Levels |
||
| 10 Day (HEFS) | 10 Day (NAEFS) | 10 Day (GEFS) |
 |
 |
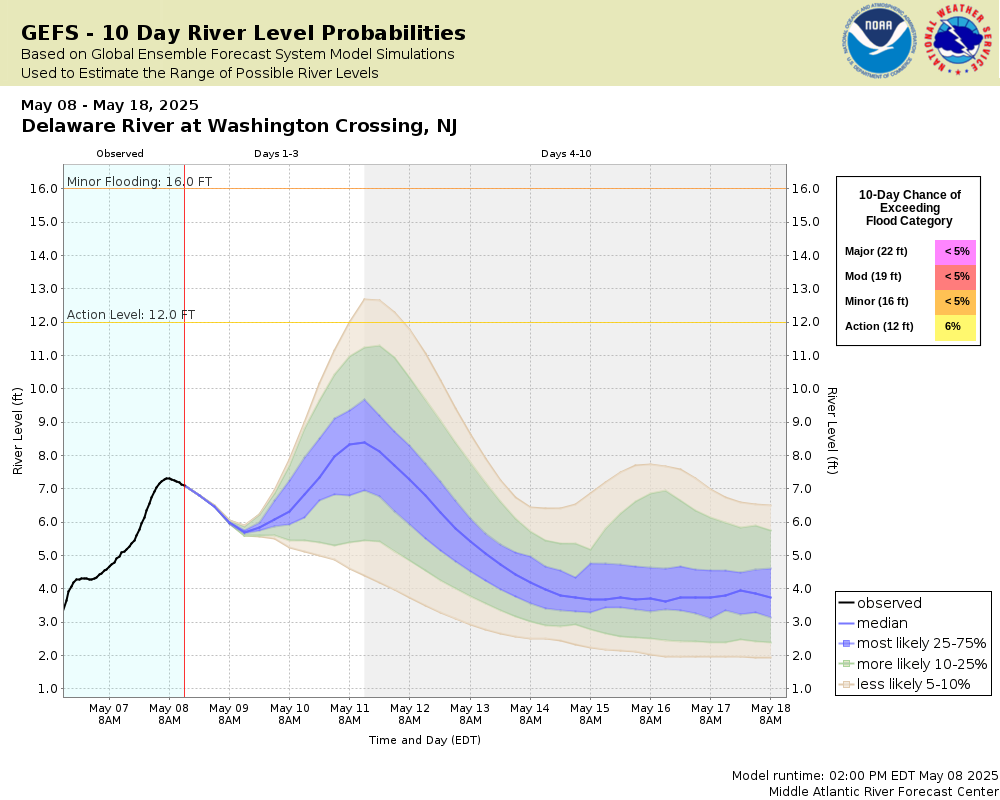 |
Note: Use the official hydrograph at the top of this web page for river levels within the next 72 hours.
Click individual graphics to enlarge.
During winter months, cold and ice may result in inaccurate real-time stream stage and streamflow data. Adjustments or deletions of this data can only be done after detailed analysis.Collaborative Agencies
The National Weather Service prepares its forecasts and other services in collaboration with agencies like the US Geological Survey, US Bureau of Reclamation, US Army Corps of Engineers, Natural Resource Conservation Service, National Park Service, ALERT Users Group, Bureau of Indian Affairs, and many state and local emergency managers across the country. For details, please click here.