Brandywine Creek at Wilmington
Future / Actual / Minor
OWP 2.0 WWA Modal Title
01/11/2021, 10:04 PM UTC through 01/11/2021, 10:04 PM UTC
Sender
Sent
- Downstream gauge unavailableWarning: no valid ratings curve available. Transformations to and from FEET/CFS/KCFS will not happen.
Traces and Thresholds Click to turn on/off display
Observed (OBS) 06/14/2025 8:15 PM EDTOfficial Forecast (FCST) 06/14/2025 10:01 AM EDTRecord: 23.1 ftLow Threshold: 0 ftCATEGORY STAGE 
Major Flooding 19 ft Moderate Flooding 18 ft Minor Flooding 16.5 ft Action 14.5 ft Reliability of the Forecast:
NOTE: Forecasts are issued routinely year-round.
National Water Model Hydrograph
Official NWS streamflow forecasts are produced by NWS hydrologic forecasters for river gauge locations using hydrologic models which are calibrated to that location. This process considers additional guidance and information, including local expertise and experience, to produce the best forecast possible. The NWM output provides supplemental guidance to NWS forecasters and should not be considered an official NWS river forecast.
Flood Impacts
- 23 - Roughly a 20 block radius on both sides of the river floods. Flooding extends to Vandever Avenue on the north side and to 14th Street on the south side. Portions of Governor Printz Boulevard floods. The North Market Street Bridge is closed.
- 22 - South Park Drive between Market Street and Van Buren Street and North Park Drive between Van Buren Street and the Swinging Bridge is closed due to flooding. The East 7th Street/7th Street Peninsula floods. Clifford Brown Walk, between East 14th Street and East 16th Street floods.
- 19.5 - Widespread flooding occurs along the creek in Wilmington. Rockland Road from Black Gates Road to Country Club Drive is flooded as is Rockland Road from Adams Drive to Mt. Lebanon Road. The 1300 block of East 12th Street is flooded impacting access to I-495.
Gauge Info
| Coordinates | 39.7695, -75.5767 |
| RFC | MARFC |
| State | DE |
| WFO | PHI |
| County | New Castle |
| Data Provider(s) | |
| US Geological Survey | USGS--Water Resources of the United States |
| USGS | 01481500 |
Gauge Location
Recent Crests
| 1. | 17.39 ft | on 01-10-2024 |
| 2. | 17.08 ft | on 12-19-2023 |
| 3. | 23.14 ft | on 09-02-2021 |
| 4. | 18.58 ft | on 08-05-2020 |
| 5. | 16.62 ft | on 08-14-2018 |
Recent Crests
| 1. | 17.39 ft | on 01-10-2024 |
| 2. | 17.08 ft | on 12-19-2023 |
| 3. | 23.14 ft | on 09-02-2021 |
| 4. | 18.58 ft | on 08-05-2020 |
| 5. | 16.62 ft | on 08-14-2018 |
| 6. | 16.90 ft | on 02-25-2016 |
| 7. | 20.43 ft | on 05-01-2014 |
| 8. | 16.70 ft | on 10-30-2012 |
| 9. | 16.70 ft | on 09-08-2011 |
| 10. | 18.71 ft | on 08-28-2011 |
| 11. | 17.34 ft | on 03-11-2011 |
| 12. | 16.90 ft | on 10-01-2010 |
| 13. | 16.43 ft | on 04-16-2007 |
Historic Crests
| 1. | 23.14 ft | on 09-02-2021 |
| 2. | 20.43 ft | on 05-01-2014 |
| 3. | 18.71 ft | on 08-28-2011 |
| 4. | 18.58 ft | on 08-05-2020 |
| 5. | 17.39 ft | on 01-10-2024 |
Historic Crests
| 1. | 23.14 ft | on 09-02-2021 |
| 2. | 20.43 ft | on 05-01-2014 |
| 3. | 18.71 ft | on 08-28-2011 |
| 4. | 18.58 ft | on 08-05-2020 |
| 5. | 17.39 ft | on 01-10-2024 |
| 6. | 17.34 ft | on 03-11-2011 |
| 7. | 17.08 ft | on 12-19-2023 |
| 8. | 16.90 ft | on 10-01-2010 |
| 9. | 16.90 ft | on 02-25-2016 |
| 10. | 16.70 ft | on 09-08-2011 |
| 11. | 16.70 ft | on 10-30-2012 |
| 12. | 16.62 ft | on 08-14-2018 |
| 13. | 16.43 ft | on 04-16-2007 |
Vertical Datum Table
| type | NAVD88 |
|---|---|
| major Flooding | 86.17 ft |
| moderate Flooding | 85.17 ft |
| minor Flooding | 83.67 ft |
| action | 81.67 ft |
| Latest Value | 79.03 ft |
| Gauge Zero | 67.17 ft |
Gauge Photos
No Images Found


Unique Local Info
|
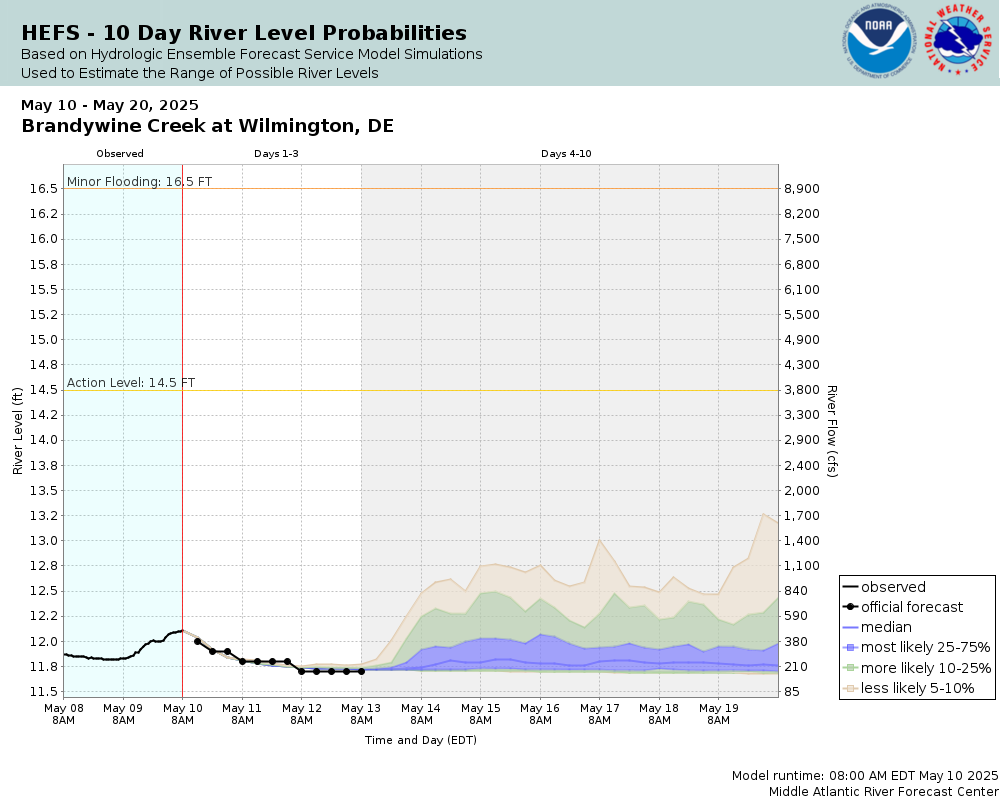
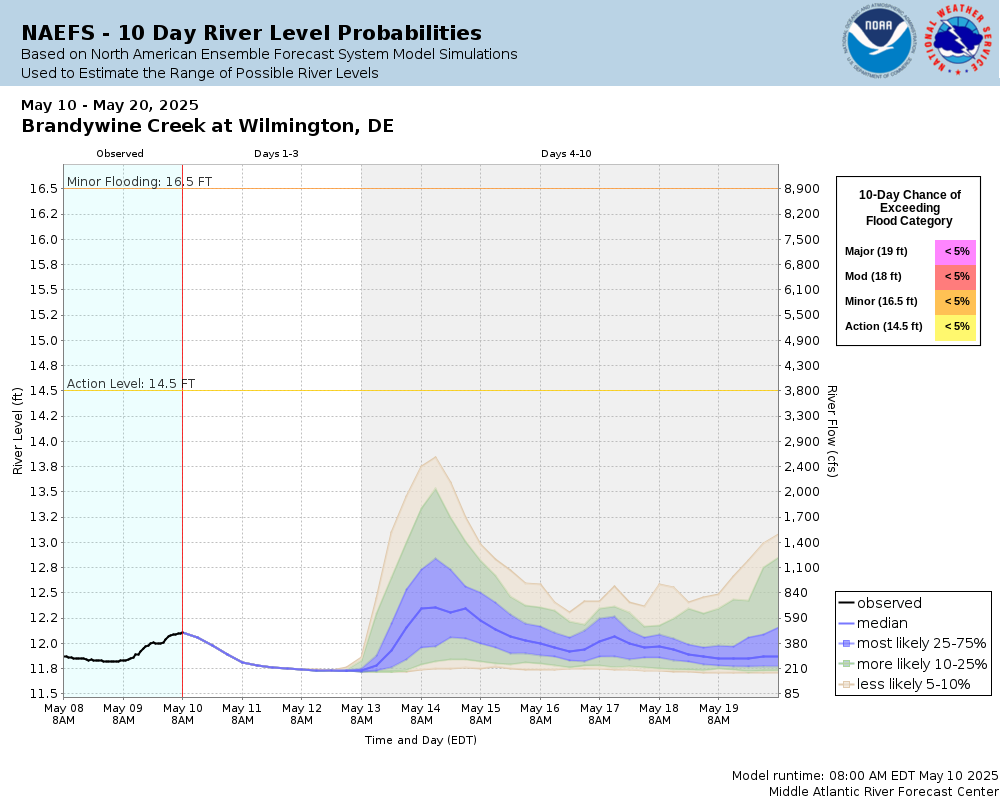
Potential River Levels Used to Estimate the Chance of Flooding and the Range of Possible River Levels |
||
| 10 Day (HEFS) | 10 Day (NAEFS) | 10 Day (GEFS) |
 |
 |
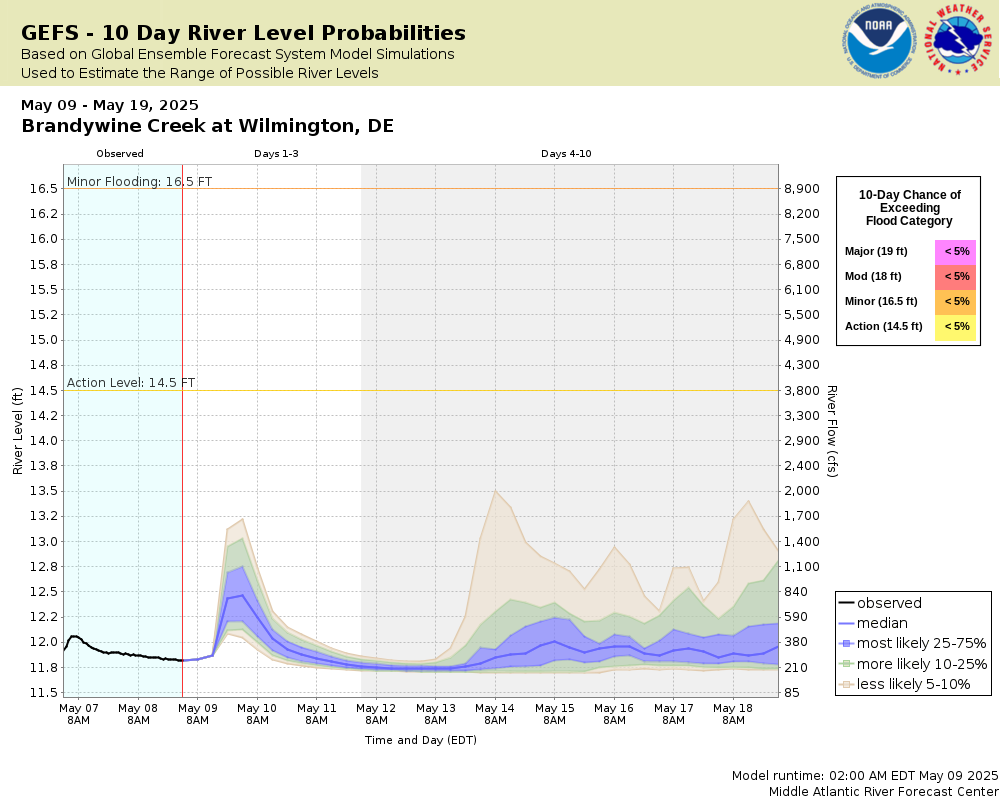 |
Note: Use the official hydrograph at the top of this web page for river levels within the next 72 hours.
Click individual graphics to enlarge.
Due to a gage relocation, the flood stage level has recently changed(9/4/2008). The relocated gage is now on the left bank (upstream side) near the Rising Sun Bridge. The gage was previously 1/2 mile downstream below Mill Dam. Historical data associated with the new gage, such as crests and low water levels, will be listed as they occur. Here are the top four crests associated with the old location...15.49 ft on 06/23/1972...15.43 ft on 09/17/1999...13.89 ft on 08/19/1955...13.83 ft on 09/13/1971. Here are the top four low water records associated with the old location...2.31 ft on 09/13/1995...2.38 ft on 08/19/1963...2.49 ft on 10/31/1963...2.57 ft on 08/31/1965. During winter months, cold and ice may result in inaccurate real-time stream stage and streamflow data. Adjustments or deletions of this data can only be done after detailed analysis.Collaborative Agencies
The National Weather Service prepares its forecasts and other services in collaboration with agencies like the US Geological Survey, US Bureau of Reclamation, US Army Corps of Engineers, Natural Resource Conservation Service, National Park Service, ALERT Users Group, Bureau of Indian Affairs, and many state and local emergency managers across the country. For details, please click here.