Westfield River at Westfield
Future / Actual / Minor
OWP 2.0 WWA Modal Title
01/11/2021, 10:04 PM UTC through 01/11/2021, 10:04 PM UTC
Sender
Sent
- Upstream gauge unavailableDownstream gauge unavailable
Traces and Thresholds Click to turn on/off display
Observed (OBS) 06/13/2025 9:15 AM EDTOfficial Forecast (FCST) 06/12/2025 11:30 AM EDTRecord: 34.2 ftCATEGORY STAGE 
Major Flooding 20 ft Moderate Flooding 16 ft Minor Flooding 13 ft Action 12 ft Reliability of the Forecast:
NOTE: Forecasts are issued routinely year-round.
National Water Model Hydrograph
Official NWS streamflow forecasts are produced by NWS hydrologic forecasters for river gauge locations using hydrologic models which are calibrated to that location. This process considers additional guidance and information, including local expertise and experience, to produce the best forecast possible. The NWM output provides supplemental guidance to NWS forecasters and should not be considered an official NWS river forecast.
Flood Impacts
- 28 - Top of river gage instrument shelf. Gage can not report higher than this level. This is a major life threatening flood. Heed the advice of local officials and evacuate if asked to do so.
- 24 - This is a major life threatening flood event from Montgomery and Russel through West Springfield and Agawam. Homes and businesses along the river will flood. Portions of Route 20 will be closed. Some residential areas and shopping centers will require evacuations. Backwater flooding on tributary streams is also anticipated. Follow the directions of emergency management officials and act quickly if you are told to evacuate.
- 22 - This is a major life threatening flood event from Montgomery and Russel through West Springfield and Agawam. Low lying homes and businesses along the river will flood. Portions of Route 20 will be closed. Some residential areas and shopping centers will require evacuations. Backwater flooding on tributary streams is also anticiapted. Follow the directions of emergency management officials and act quickly if you are told to evacuate.
Gauge Info
| Coordinates | 42.1068, -72.6990 |
| RFC | NERFC |
| State | MA |
| WFO | BOX |
| County | Hampden |
| Data Provider(s) | |
| US Geological Survey | USGS--Water Resources of the United States |
| USGS | 01183500 |
Gauge Location
Recent Crests
| 1. | 15.39 ft | on 12-18-2023 |
| 2. | 13.72 ft | on 09-02-2021 |
| 3. | 13.88 ft | on 07-19-2021 |
| 4. | 12.93 ft | on 11-03-2018 |
| 5. | 13.59 ft | on 01-13-2018 |
Recent Crests
| 1. | 15.39 ft | on 12-18-2023 |
| 2. | 13.72 ft | on 09-02-2021 |
| 3. | 13.88 ft | on 07-19-2021 |
| 4. | 12.93 ft | on 11-03-2018 |
| 5. | 13.59 ft | on 01-13-2018 |
| 6. | 19.92 ft | on 08-28-2011 |
| 7. | 14.25 ft | on 03-07-2011 |
| 8. | 18.78 ft | on 04-16-2007 |
| 9. | 12.90 ft | on 10-15-2005 |
| 10. | 16.63 ft | on 10-09-2005 |
| 11. | 12.87 ft | on 04-03-2005 |
| 12. | 12.55 ft | on 06-07-2000 |
| 13. | 13.10 ft | on 09-17-1999 |
| 14. | 13.25 ft | on 03-22-1999 |
| 15. | 12.80 ft | on 01-28-1996 |
| 16. | 10.00 ft | on 12-24-1995 |
| 17. | 12.22 ft | on 03-29-1993 |
| 18. | 17.91 ft | on 04-05-1987 |
| 19. | 14.30 ft | on 02-20-1981 |
| 20. | 19.95 ft | on 03-22-1980 |
| 21. | 12.92 ft | on 09-26-1975 |
| 22. | 12.47 ft | on 04-05-1960 |
| 23. | 21.79 ft | on 10-16-1955 |
| 24. | 34.20 ft | on 08-19-1955 |
| 25. | 16.51 ft | on 11-26-1951 |
| 26. | 22.00 ft | on 12-31-1948 |
| 27. | 17.90 ft | on 09-22-1938 |
| 28. | 27.20 ft | on 03-18-1936 |
| 29. | 15.45 ft | on 01-10-1935 |
| 30. | 16.54 ft | on 04-12-1934 |
| 31. | 22.66 ft | on 06-16-1933 |
| 32. | 25.41 ft | on 11-04-1928 |
| 33. | 22.13 ft | on 04-07-1924 |
| 34. | 17.00 ft | on 04-13-1920 |
| 35. | 18.26 ft | on 02-25-1915 |
Historic Crests
| 1. | 34.20 ft | on 08-19-1955 |
| 2. | 27.20 ft | on 03-18-1936 |
| 3. | 25.41 ft | on 11-04-1928 |
| 4. | 22.66 ft | on 06-16-1933 |
| 5. | 22.13 ft | on 04-07-1924 |
Historic Crests
| 1. | 34.20 ft | on 08-19-1955 |
| 2. | 27.20 ft | on 03-18-1936 |
| 3. | 25.41 ft | on 11-04-1928 |
| 4. | 22.66 ft | on 06-16-1933 |
| 5. | 22.13 ft | on 04-07-1924 |
| 6. | 22.00 ft | on 12-31-1948 |
| 7. | 21.79 ft | on 10-16-1955 |
| 8. | 19.95 ft | on 03-22-1980 |
| 9. | 19.92 ft | on 08-28-2011 |
| 10. | 18.78 ft | on 04-16-2007 |
| 11. | 18.26 ft | on 02-25-1915 |
| 12. | 17.91 ft | on 04-05-1987 |
| 13. | 17.90 ft | on 09-22-1938 |
| 14. | 17.00 ft | on 04-13-1920 |
| 15. | 16.63 ft | on 10-09-2005 |
| 16. | 16.54 ft | on 04-12-1934 |
| 17. | 16.51 ft | on 11-26-1951 |
| 18. | 15.45 ft | on 01-10-1935 |
| 19. | 15.39 ft | on 12-18-2023 |
| 20. | 14.30 ft | on 02-20-1981 |
| 21. | 14.25 ft | on 03-07-2011 |
| 22. | 13.88 ft | on 07-19-2021 |
| 23. | 13.72 ft | on 09-02-2021 |
| 24. | 13.59 ft | on 01-13-2018 |
| 25. | 13.25 ft | on 03-22-1999 |
| 26. | 13.10 ft | on 09-17-1999 |
| 27. | 12.93 ft | on 11-03-2018 |
| 28. | 12.92 ft | on 09-26-1975 |
| 29. | 12.90 ft | on 10-15-2005 |
| 30. | 12.87 ft | on 04-03-2005 |
| 31. | 12.80 ft | on 01-28-1996 |
| 32. | 12.55 ft | on 06-07-2000 |
| 33. | 12.47 ft | on 04-05-1960 |
| 34. | 12.22 ft | on 03-29-1993 |
| 35. | 10.00 ft | on 12-24-1995 |
Vertical Datum Table
| type | NAVD88 |
|---|---|
| major Flooding | 117.52 ft |
| moderate Flooding | 113.52 ft |
| minor Flooding | 110.52 ft |
| action | 109.52 ft |
| Latest Value | 102.50 ft |
| Gauge Zero | 97.52 ft |
Gauge Photos
No Images Found


Unique Local Info
|
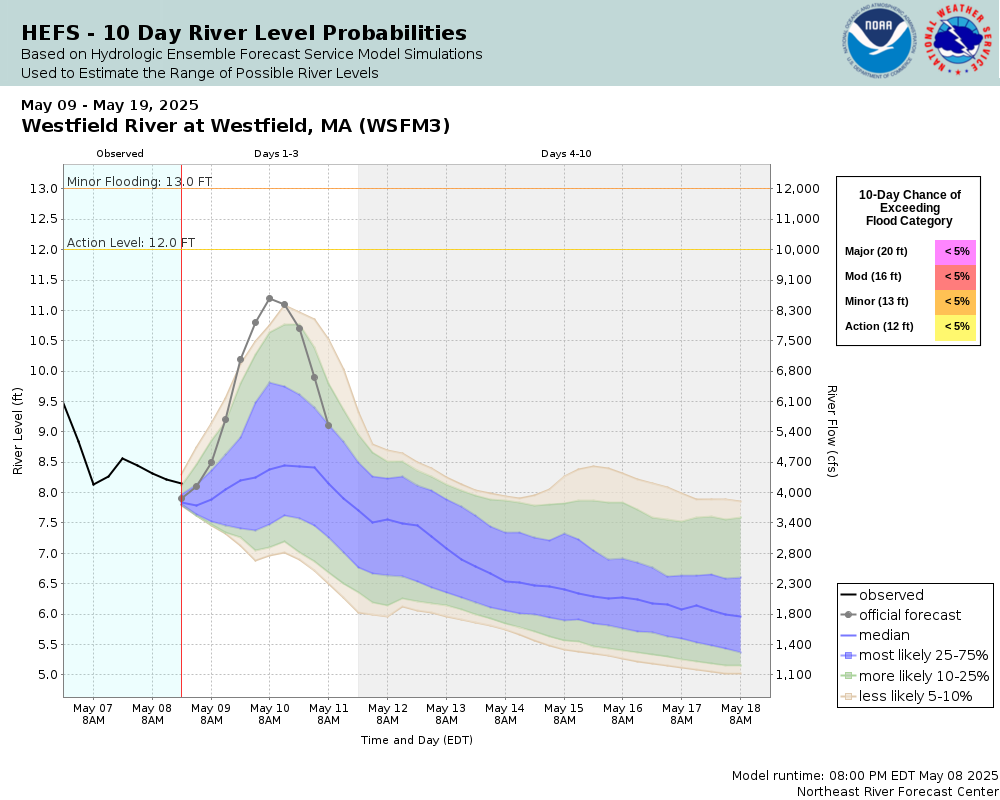
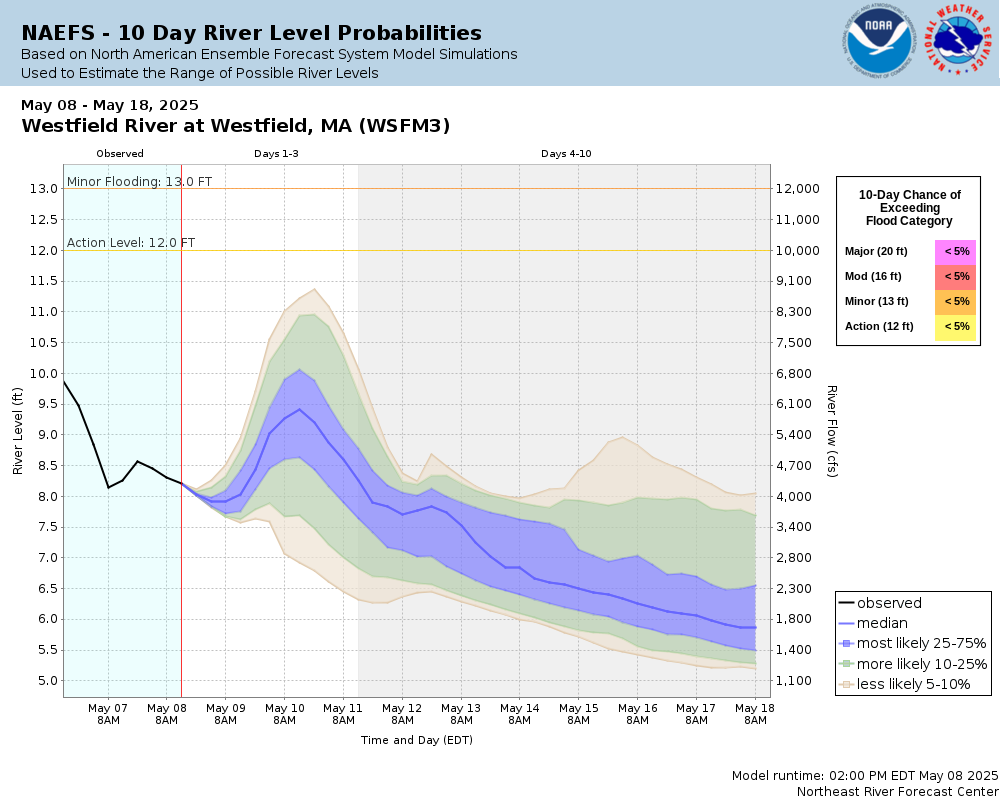
Potential River Levels Used to Estimate the Chance of Flooding and the Range of Possible River Levels |
||
| 10 Day (HEFS) | 10 Day (NAEFS) | 10 Day (GEFS) |
 |
 |
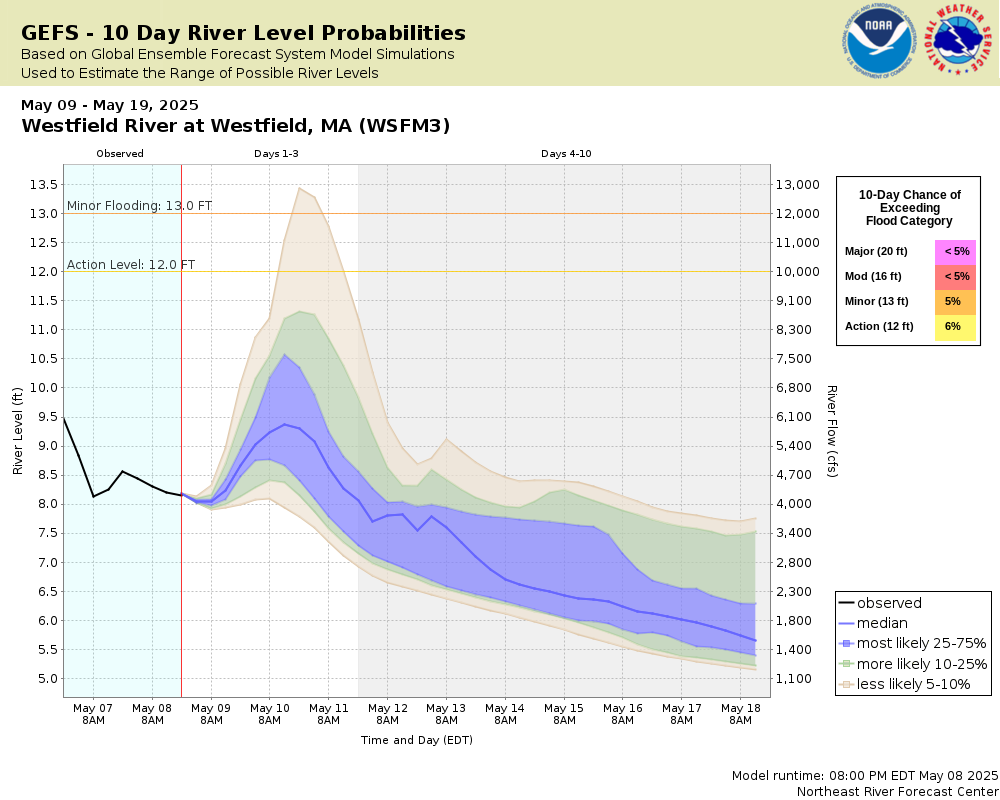 |
Note: Use the official hydrograph at the top of this web page for river levels within the next 72 hours.
Click individual graphics to enlarge.
Collaborative Agencies
The National Weather Service prepares its forecasts and other services in collaboration with agencies like the US Geological Survey, US Bureau of Reclamation, US Army Corps of Engineers, Natural Resource Conservation Service, National Park Service, ALERT Users Group, Bureau of Indian Affairs, and many state and local emergency managers across the country. For details, please click here.