Cashie River near Windsor
Future / Actual / Minor
OWP 2.0 WWA Modal Title
01/11/2021, 10:04 PM UTC through 01/11/2021, 10:04 PM UTC
Sender
Sent
- Upstream gauge unavailableDownstream gauge unavailableWarning: no valid ratings curve available. Transformations to and from FEET/CFS/KCFS will not happen.
Traces and Thresholds Click to turn on/off display
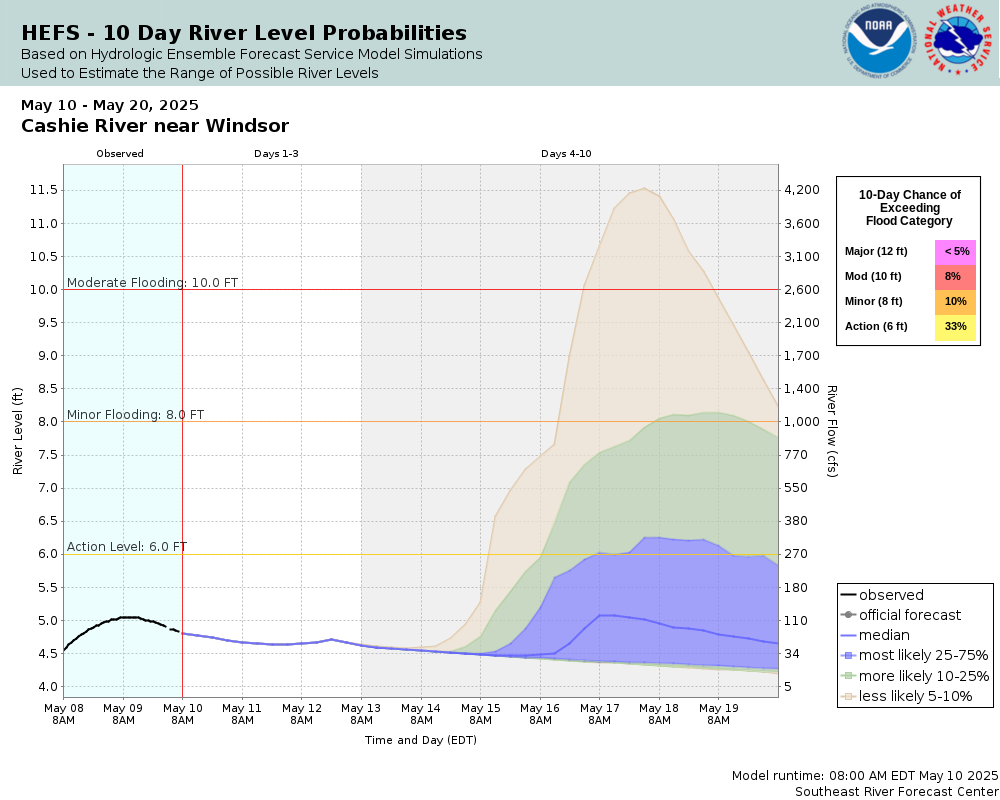
CATEGORY STAGE Major Flooding 12 ft Moderate Flooding 10 ft Minor Flooding 8 ft Action 6 ft Reliability of the Forecast:
NOTE: Forecasts are issued as needed during times of high water, but are not routinely available.
National Water Model Hydrograph
Official NWS streamflow forecasts are produced by NWS hydrologic forecasters for river gauge locations using hydrologic models which are calibrated to that location. This process considers additional guidance and information, including local expertise and experience, to produce the best forecast possible. The NWM output provides supplemental guidance to NWS forecasters and should not be considered an official NWS river forecast.
Flood Impacts
- 16.79 - River stage sensor operating limit
- 16 - Most buildings south of Camden Street along Sutton Street and Queen Street are inundated. Most structures south of the river along us 17 to Rhodes Ave are flooded.
- 15 - US 17 south of town, US 13 north of town and Hoggards Mill Rd are inundated.
- 14 - School Rd begins to flood with water over the bridge in the vicinity of the river gage. Businesses along King Street, Granville Street, and Camden Street in town are inundated with several feet of water. Homes south of the river along Maple and Elm St are inundated.
- 13 - Houses north of town along Baker, Thompson and Joyner St are surrounded by water. Portions of Hoggard Mill Creek and US 13 north of town are flooded. Businesses and homes along US 17 south of town begin to flood.
- 12 - Business along King St are flooded between Elmo St and Granville St. The Highway 17 bridge south of town begins to flood and Sutton Dr is flooding.
- 10 - Livermon Park and Zoo are inundated. Portions of King St, Granville St, Queen St, Rascoe St and Camden St are flooded.
- 8 - Portions of N. York St, Davis Ball Park and the Cashie Wetlands Walk begin to flood.
Gauge Info
| Coordinates | 36.0481, -76.9842 |
| RFC | SERFC |
| State | NC |
| WFO | AKQ |
| County | Bertie |
| Data Provider(s) | |
| US Geological Survey | USGS--Water Resources of the United States |
| USGS | 0208111310 |
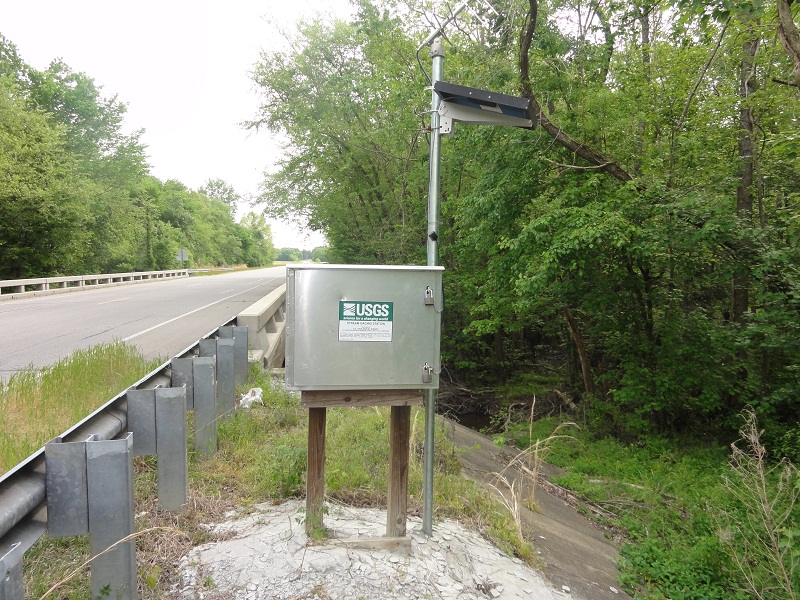
Gauge Location
Recent Crests
| 1. | 7.95 ft | on 06-18-2025 | (P) |
| 2. | 6.35 ft | on 04-09-2025 | (P) |
| 3. | 6.31 ft | on 02-14-2025 | (P) |
| 4. | 7.06 ft | on 12-19-2023 | |
| 5. | 6.62 ft | on 01-27-2023 |
Recent Crests
| 1. | 7.95 ft | on 06-18-2025 | (P) |
| 2. | 6.35 ft | on 04-09-2025 | (P) |
| 3. | 6.31 ft | on 02-14-2025 | (P) |
| 4. | 7.06 ft | on 12-19-2023 | |
| 5. | 6.62 ft | on 01-27-2023 | |
| 6. | 9.66 ft | on 06-12-2021 | |
| 7. | 9.62 ft | on 06-05-2021 | |
| 8. | 9.21 ft | on 02-16-2021 | |
| 9. | 8.44 ft | on 01-04-2021 | |
| 10. | 11.51 ft | on 11-13-2020 | |
| 11. | 10.74 ft | on 02-08-2020 | |
| 12. | 6.07 ft | on 09-07-2019 | |
| 13. | 6.42 ft | on 08-25-2019 | |
| 14. | 6.51 ft | on 04-15-2019 | |
| 15. | 7.04 ft | on 03-05-2019 | |
| 16. | 9.36 ft | on 02-25-2019 | |
| 17. | 6.69 ft | on 01-27-2019 | |
| 18. | 6.06 ft | on 01-16-2019 | |
| 19. | 6.33 ft | on 12-17-2018 | |
| 20. | 7.14 ft | on 12-12-2018 | |
| 21. | 9.17 ft | on 08-01-2018 | |
| 22. | 7.29 ft | on 05-24-2018 | |
| 23. | 8.83 ft | on 04-27-2017 | |
| 24. | 16.63 ft | on 10-09-2016 | |
| 25. | 14.78 ft | on 09-22-2016 | |
| 26. | 8.15 ft | on 02-26-2016 | |
| 27. | 9.80 ft | on 02-06-2016 | |
| 28. | 8.07 ft | on 01-25-2016 | |
| 29. | 8.40 ft | on 01-02-2016 | |
| 30. | 8.63 ft | on 12-25-2014 | |
| 31. | 9.24 ft | on 08-05-2014 | |
| 32. | 12.14 ft | on 08-28-2011 | |
| 33. | 15.69 ft | on 10-01-2010 | |
| 34. | 8.33 ft | on 03-31-2010 | |
| 35. | 9.51 ft | on 02-07-2010 | |
| 36. | 8.33 ft | on 12-10-2009 | |
| 37. | 7.21 ft | on 03-31-2009 | |
| 38. | 7.37 ft | on 02-19-2008 | |
| 39. | 8.87 ft | on 11-23-2006 | |
| 40. | 8.65 ft | on 11-14-2006 | |
| 41. | 10.54 ft | on 09-03-2006 | |
| 42. | 11.41 ft | on 06-16-2006 | |
| 43. | 6.43 ft | on 03-20-2005 | |
| 44. | 12.24 ft | on 08-16-2004 | |
| 45. | 11.78 ft | on 09-20-2003 | |
| 46. | 5.50 ft | on 04-02-2002 | |
| 47. | 12.07 ft | on 06-17-2001 | |
| 48. | 12.52 ft | on 10-19-1999 | |
| 49. | 18.52 ft | on 09-16-1999 | |
| 50. | 11.49 ft | on 02-06-1998 | |
| 51. | 8.92 ft | on 10-10-1996 | |
| 52. | 8.67 ft | on 09-05-1996 | |
| 53. | 7.95 ft | on 02-19-1995 | |
| 54. | 10.07 ft | on 03-04-1994 | |
| 55. | 9.13 ft | on 01-10-1993 | |
| 56. | 11.51 ft | on 08-18-1992 | |
| 57. | 8.76 ft | on 07-31-1991 | |
| 58. | 8.66 ft | on 10-04-1989 | |
| 59. | 9.57 ft | on 05-03-1989 | |
| 60. | 5.94 ft | on 04-21-1988 |
Historic Crests
| 1. | 18.52 ft | on 09-16-1999 |
| 2. | 16.63 ft | on 10-09-2016 |
| 3. | 15.69 ft | on 10-01-2010 |
| 4. | 14.78 ft | on 09-22-2016 |
| 5. | 12.52 ft | on 10-19-1999 |
Historic Crests
| 1. | 18.52 ft | on 09-16-1999 | |
| 2. | 16.63 ft | on 10-09-2016 | |
| 3. | 15.69 ft | on 10-01-2010 | |
| 4. | 14.78 ft | on 09-22-2016 | |
| 5. | 12.52 ft | on 10-19-1999 | |
| 6. | 12.24 ft | on 08-16-2004 | |
| 7. | 12.14 ft | on 08-28-2011 | |
| 8. | 12.07 ft | on 06-17-2001 | |
| 9. | 11.78 ft | on 09-20-2003 | |
| 10. | 11.51 ft | on 08-18-1992 | |
| 11. | 11.51 ft | on 11-13-2020 | |
| 12. | 11.49 ft | on 02-06-1998 | |
| 13. | 11.41 ft | on 06-16-2006 | |
| 14. | 10.74 ft | on 02-08-2020 | |
| 15. | 10.54 ft | on 09-03-2006 | |
| 16. | 10.07 ft | on 03-04-1994 | |
| 17. | 9.80 ft | on 02-06-2016 | |
| 18. | 9.66 ft | on 06-12-2021 | |
| 19. | 9.62 ft | on 06-05-2021 | |
| 20. | 9.57 ft | on 05-03-1989 | |
| 21. | 9.51 ft | on 02-07-2010 | |
| 22. | 9.36 ft | on 02-25-2019 | |
| 23. | 9.24 ft | on 08-05-2014 | |
| 24. | 9.21 ft | on 02-16-2021 | |
| 25. | 9.17 ft | on 08-01-2018 | |
| 26. | 9.13 ft | on 01-10-1993 | |
| 27. | 8.92 ft | on 10-10-1996 | |
| 28. | 8.87 ft | on 11-23-2006 | |
| 29. | 8.83 ft | on 04-27-2017 | |
| 30. | 8.76 ft | on 07-31-1991 | |
| 31. | 8.67 ft | on 09-05-1996 | |
| 32. | 8.66 ft | on 10-04-1989 | |
| 33. | 8.65 ft | on 11-14-2006 | |
| 34. | 8.63 ft | on 12-25-2014 | |
| 35. | 8.44 ft | on 01-04-2021 | |
| 36. | 8.40 ft | on 01-02-2016 | |
| 37. | 8.33 ft | on 12-10-2009 | |
| 38. | 8.33 ft | on 03-31-2010 | |
| 39. | 8.15 ft | on 02-26-2016 | |
| 40. | 8.07 ft | on 01-25-2016 | |
| 41. | 7.95 ft | on 02-19-1995 | |
| 42. | 7.95 ft | on 06-18-2025 | (P) |
| 43. | 7.37 ft | on 02-19-2008 | |
| 44. | 7.29 ft | on 05-24-2018 | |
| 45. | 7.21 ft | on 03-31-2009 | |
| 46. | 7.14 ft | on 12-12-2018 | |
| 47. | 7.06 ft | on 12-19-2023 | |
| 48. | 7.04 ft | on 03-05-2019 | |
| 49. | 6.69 ft | on 01-27-2019 | |
| 50. | 6.62 ft | on 01-27-2023 | |
| 51. | 6.51 ft | on 04-15-2019 | |
| 52. | 6.43 ft | on 03-20-2005 | |
| 53. | 6.42 ft | on 08-25-2019 | |
| 54. | 6.35 ft | on 04-09-2025 | (P) |
| 55. | 6.33 ft | on 12-17-2018 | |
| 56. | 6.31 ft | on 02-14-2025 | (P) |
| 57. | 6.07 ft | on 09-07-2019 | |
| 58. | 6.06 ft | on 01-16-2019 | |
| 59. | 5.94 ft | on 04-21-1988 | |
| 60. | 5.50 ft | on 04-02-2002 |
Vertical Datum Table
| type | NAVD88 |
|---|---|
| major Flooding | 15.00 ft |
| moderate Flooding | 13.00 ft |
| minor Flooding | 11.00 ft |
| action | 9.00 ft |
| Latest Value | 7.00 ft |
| Gauge Zero | 3.00 ft |
Gauge Photos
No Images Found


Unique Local Info
|
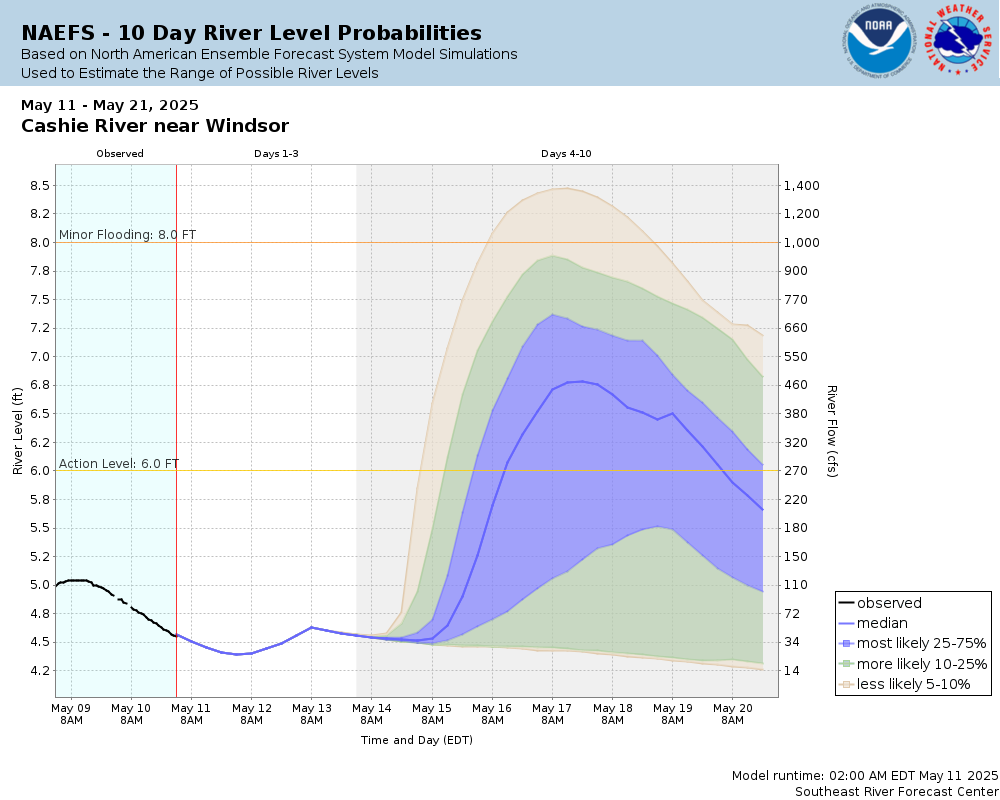
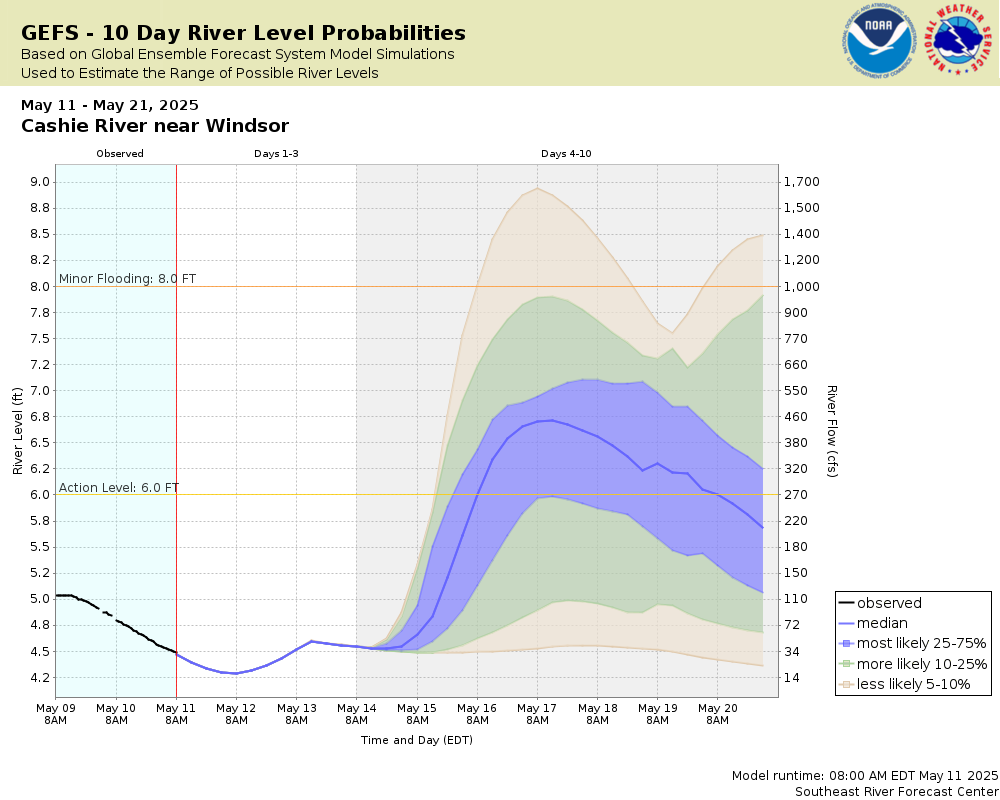
Potential River Levels Used to Estimate the Chance of Flooding and the Range of Possible River Levels |
||
| 10 Day (HEFS) | 7 Day (NAEFS) | 7 Day (GEFS) |
 |
 Â Â |
 Â Â |
Note: Use the official hydrograph at the top of this web page for river levels within the next 72 hours.
See the Product Description Document link for more details on the interpretation of the 7,10 day graphics.
Click individual graphics to enlarge.
|
|
|
|
||||||
|
Additional Water and Weather Topics from the
Southeast River Forecast Center (SERFC): |
||||||||
Collaborative Agencies
The National Weather Service prepares its forecasts and other services in collaboration with agencies like the US Geological Survey, US Bureau of Reclamation, US Army Corps of Engineers, Natural Resource Conservation Service, National Park Service, ALERT Users Group, Bureau of Indian Affairs, and many state and local emergency managers across the country. For details, please click here.