Mohawk River at Schenectady (Freeman's Bridge)
Future / Actual / Minor
OWP 2.0 WWA Modal Title
01/11/2021, 10:04 PM UTC through 01/11/2021, 10:04 PM UTC
Sender
Sent
- Warning: no valid ratings curve available. Transformations to and from FEET/CFS/KCFS will not happen.
Traces and Thresholds Click to turn on/off display
CATEGORY STAGE Major Flooding 224 ft Moderate Flooding 222 ft Minor Flooding 220 ft Action 216 ft Reliability of the Forecast:
NOTE: Forecasts are issued as needed during times of high water, but are not routinely available.
National Water Model Hydrograph
Official NWS streamflow forecasts are produced by NWS hydrologic forecasters for river gauge locations using hydrologic models which are calibrated to that location. This process considers additional guidance and information, including local expertise and experience, to produce the best forecast possible. The NWM output provides supplemental guidance to NWS forecasters and should not be considered an official NWS river forecast.
Flood Impacts
- 226.41 - Water reaches the same level as was reached with Tropical Storm Irene in 2011.
- 226 - The North Ferry Street gage reads about 230 feet. Water floods the former Alco plant area on Erie Boulevard Extension, Edison Avenue and Van Guysling Avenue, Broadway between Edison Avenue and Clinton Street, and River Street. National Grid substation at River Street requires protection. In Scotia Schonowee, Washington, and Livingston Avenues are flooded and water is in homes throughout the area. Collins Park is flooded.
- 222 - The North Ferry Street gage reads about 226 feet. Water floods three fourths of Ingersoll Avenue, half of North Street, Ferry Street, East Front Street, and River Street. National Grid substation protection is necessary. In Scotia Schonowee Avenue is flooded and water is in yards and basements.
Gauge Info
| Coordinates | 42.8306, -73.9308 |
| RFC | NERFC |
| State | NY |
| WFO | ALY |
| County | Schenectady |
| Data Provider(s) | |
| US Geological Survey | USGS--Water Resources of the United States |
| USGS | 01354500 |
Gauge Location
Recent Crests
| 1. | 220.95 ft | on 04-08-2022 | (P) |
| 2. | 219.41 ft | on 11-02-2019 | (P) |
| 3. | 223.82 ft | on 02-22-2018 | |
| 4. | 222.63 ft | on 01-14-2018 | |
| 5. | 220.86 ft | on 01-13-2014 |
Recent Crests
| 1. | 220.95 ft | on 04-08-2022 | (P) |
| 2. | 219.41 ft | on 11-02-2019 | (P) |
| 3. | 223.82 ft | on 02-22-2018 | |
| 4. | 222.63 ft | on 01-14-2018 | |
| 5. | 220.86 ft | on 01-13-2014 | |
| 6. | 220.00 ft | on 06-14-2013 | |
| 7. | 226.41 ft | on 08-29-2011 | |
| 8. | 223.00 ft | on 01-26-2010 | |
| 9. | 224.00 ft | on 04-17-2007 | |
| 10. | 226.00 ft | on 03-15-2007 | |
| 11. | 226.50 ft | on 06-29-2006 | |
| 12. | 225.90 ft | on 04-04-2005 | |
| 13. | 224.60 ft | on 01-10-1998 | |
| 14. | 228.00 ft | on 01-20-1996 | |
| 15. | 227.00 ft | on 03-16-1986 | |
| 16. | 221.60 ft | on 12-14-1983 | |
| 17. | 222.10 ft | on 02-20-1981 | |
| 18. | 213.90 ft | on 02-12-1981 | |
| 19. | 226.00 ft | on 03-22-1980 | |
| 20. | 225.00 ft | on 03-06-1979 | |
| 21. | 224.50 ft | on 10-17-1977 | |
| 22. | 226.50 ft | on 03-14-1977 | |
| 23. | 226.50 ft | on 02-19-1976 | |
| 24. | 224.50 ft | on 03-06-1964 | |
| 25. | 224.00 ft | on 10-17-1955 | |
| 26. | 229.20 ft | on 03-19-1936 | |
| 27. | 227.70 ft | on 03-15-1929 | |
| 28. | 227.70 ft | on 04-02-1916 | |
| 29. | 232.90 ft | on 03-28-1914 | |
| 30. | 228.90 ft | on 03-28-1913 |
Historic Crests
| 1. | 232.90 ft | on 03-28-1914 |
| 2. | 229.20 ft | on 03-19-1936 |
| 3. | 228.90 ft | on 03-28-1913 |
| 4. | 228.00 ft | on 01-20-1996 |
| 5. | 227.70 ft | on 03-15-1929 |
Historic Crests
| 1. | 232.90 ft | on 03-28-1914 | |
| 2. | 229.20 ft | on 03-19-1936 | |
| 3. | 228.90 ft | on 03-28-1913 | |
| 4. | 228.00 ft | on 01-20-1996 | |
| 5. | 227.70 ft | on 03-15-1929 | |
| 6. | 227.70 ft | on 04-02-1916 | |
| 7. | 227.00 ft | on 03-16-1986 | |
| 8. | 226.50 ft | on 03-14-1977 | |
| 9. | 226.50 ft | on 06-29-2006 | |
| 10. | 226.50 ft | on 02-19-1976 | |
| 11. | 226.41 ft | on 08-29-2011 | |
| 12. | 226.00 ft | on 03-15-2007 | |
| 13. | 226.00 ft | on 03-22-1980 | |
| 14. | 225.90 ft | on 04-04-2005 | |
| 15. | 225.00 ft | on 03-06-1979 | |
| 16. | 224.60 ft | on 01-10-1998 | |
| 17. | 224.50 ft | on 03-06-1964 | |
| 18. | 224.50 ft | on 10-17-1977 | |
| 19. | 224.00 ft | on 04-17-2007 | |
| 20. | 224.00 ft | on 10-17-1955 | |
| 21. | 223.82 ft | on 02-22-2018 | |
| 22. | 223.00 ft | on 01-26-2010 | |
| 23. | 222.63 ft | on 01-14-2018 | |
| 24. | 222.10 ft | on 02-20-1981 | |
| 25. | 221.60 ft | on 12-14-1983 | |
| 26. | 220.95 ft | on 04-08-2022 | (P) |
| 27. | 220.86 ft | on 01-13-2014 | |
| 28. | 220.00 ft | on 06-14-2013 | |
| 29. | 219.41 ft | on 11-02-2019 | (P) |
| 30. | 213.90 ft | on 02-12-1981 |
Vertical Datum Table
| type | NGVD29 |
|---|---|
| major Flooding | 224.00 ft |
| moderate Flooding | 222.00 ft |
| minor Flooding | 220.00 ft |
| action | 216.00 ft |
| Latest Value | 212.13 ft |
| Gauge Zero | 0.00 ft |
Gauge Photos
No Images Found
Probability Information
No Images Available
Unique Local Info
|
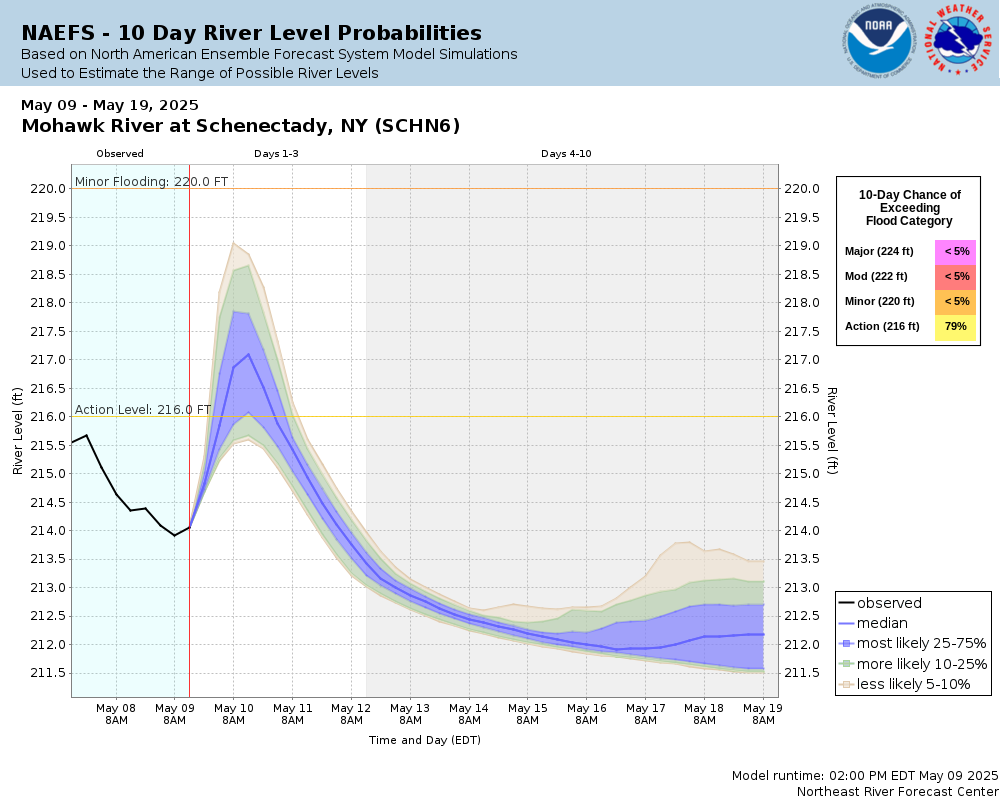
Potential River Levels Used to Estimate the Chance of Flooding and the Range of Possible River Levels |
||
| 10 Day (HEFS) | 10 Day (NAEFS) | 10 Day (GEFS) |
 |
 |
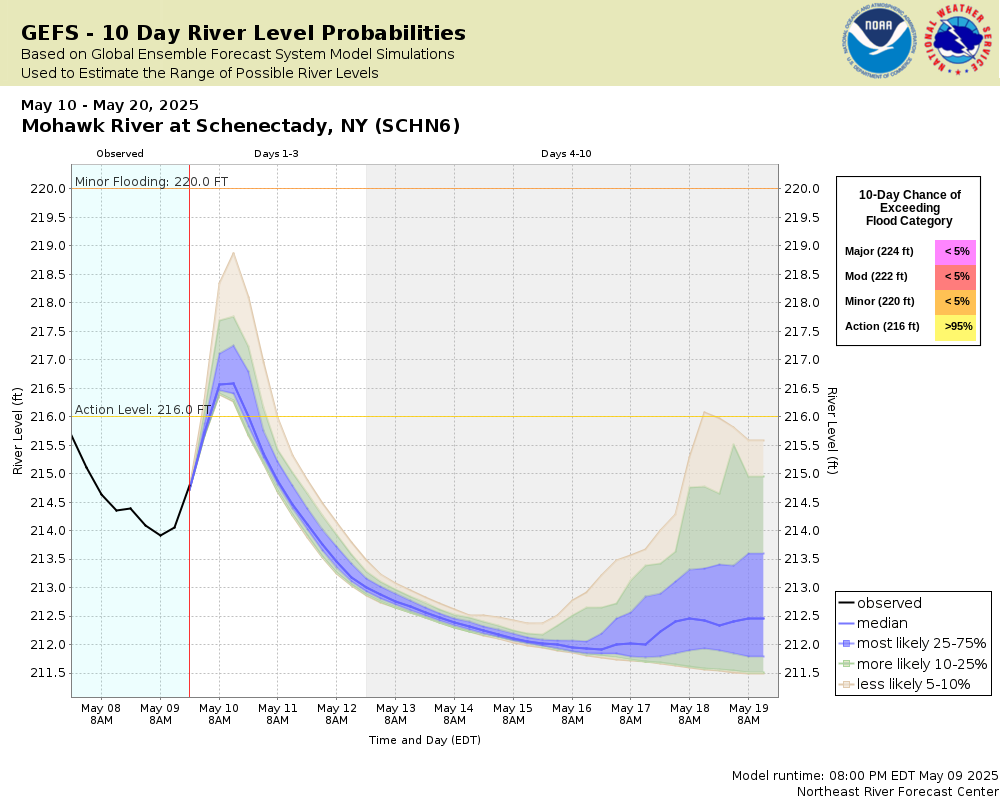 |
Note: Use the official hydrograph at the top of this web page for river levels within the next 72 hours.
Click individual graphics to enlarge.
Historical crests recorded before January 2011 are listed for public reference but not comparable to crests recorded after January 2011. Before January 2011, crests were manually read at the North Ferry Street gage which is upstream of the current automated gage and as such, readings are not comparable.Collaborative Agencies
The National Weather Service prepares its forecasts and other services in collaboration with agencies like the US Geological Survey, US Bureau of Reclamation, US Army Corps of Engineers, Natural Resource Conservation Service, National Park Service, ALERT Users Group, Bureau of Indian Affairs, and many state and local emergency managers across the country. For details, please click here.