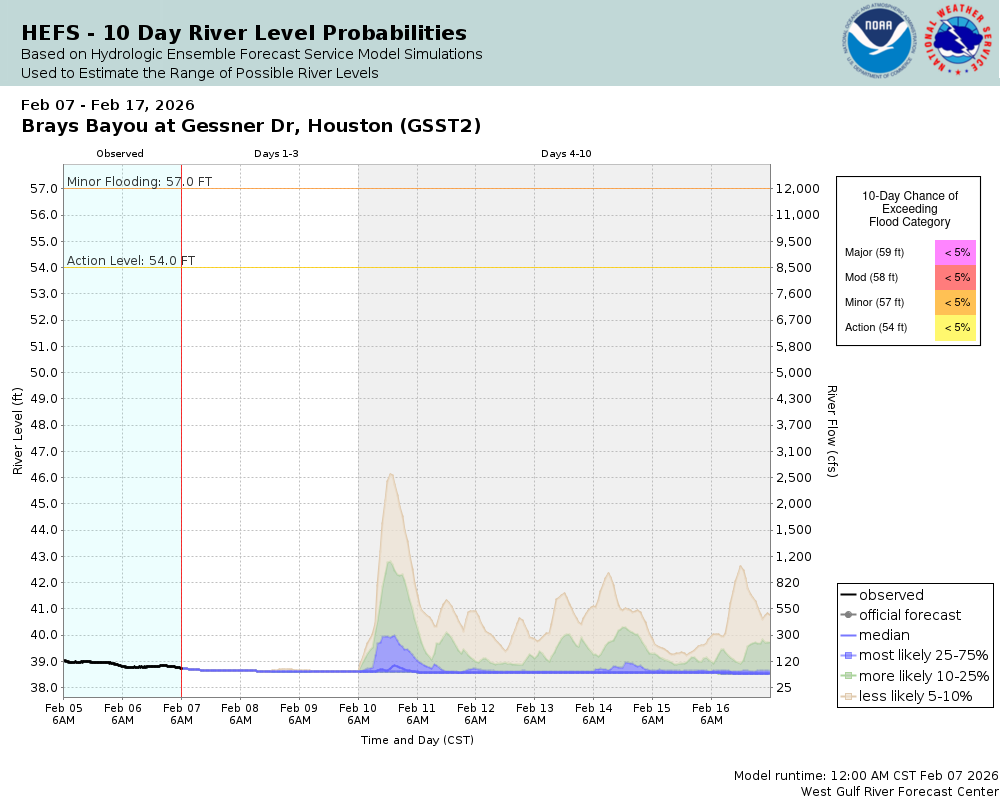
Brays Bayou at Gessner Drive
Future / Actual / Minor
OWP 2.0 WWA Modal Title
01/11/2021, 10:04 PM UTC through 01/11/2021, 10:04 PM UTC
Sender
Sent
- Upstream gauge unavailableWarning: no valid ratings curve available. Transformations to and from FEET/CFS/KCFS will not happen.
Traces and Thresholds Click to turn on/off display
CATEGORY STAGE Major Flooding 59 ft Moderate Flooding 58 ft Minor Flooding 57 ft Action 54 ft Reliability of the Forecast:
NOTE: Forecasts are issued as needed during times of high water, but are not routinely available.
National Water Model Hydrograph
Official NWS streamflow forecasts are produced by NWS hydrologic forecasters for river gauge locations using hydrologic models which are calibrated to that location. This process considers additional guidance and information, including local expertise and experience, to produce the best forecast possible. The NWM output provides supplemental guidance to NWS forecasters and should not be considered an official NWS river forecast.
Flood Impacts
- 59 - Major flooding begins with homes flooded in the Braeburn Glen subdivision and numerous homes nearing flood in the Braeburn Valley subdivision. Many streets are flooded and impassable including Fondren Drive near the channel and North and South Braeswood Blvd. Gessner Road bridge deck overtopped and inundated with approximately 1.25ft of water.
- 58 - Moderate flooding begins with numerous streets flooded in the Braeburn Glen and Braeburn Valley subdivisions. Fondren bridge approaches are impassable and water is hitting bridge deck. Water is nearing homes in the Braeburn Glen subdivision along Valley View Drive, Kennard and Mahoning Street.
- 57 - Minor flooding begins along Fondren Drive north and south of the channel. Flooding is likely along Valley View Drive in the Braeburn Valley subdivision.
Gauge Location
Recent Crests
| 1. | 60.00 ft | on 08-27-2017 |
| 2. | 59.00 ft | on 04-18-2016 |
| 3. | 61.26 ft | on 04-18-2016 |
| 4. | 61.60 ft | on 05-26-2015 |
| 5. | 58.27 ft | on 01-09-2012 |
Recent Crests
| 1. | 60.00 ft | on 08-27-2017 |
| 2. | 59.00 ft | on 04-18-2016 |
| 3. | 61.26 ft | on 04-18-2016 |
| 4. | 61.60 ft | on 05-26-2015 |
| 5. | 58.27 ft | on 01-09-2012 |
| 6. | 60.78 ft | on 11-17-2003 |
| 7. | 56.73 ft | on 06-09-2001 |
| 8. | 56.85 ft | on 09-11-1998 |
| 9. | 59.45 ft | on 10-18-1994 |
| 10. | 61.15 ft | on 03-04-1992 |
| 11. | 61.35 ft | on 09-19-1983 |
Historic Crests
| 1. | 61.60 ft | on 05-26-2015 |
| 2. | 61.35 ft | on 09-19-1983 |
| 3. | 61.26 ft | on 04-18-2016 |
| 4. | 61.15 ft | on 03-04-1992 |
| 5. | 60.78 ft | on 11-17-2003 |
Historic Crests
| 1. | 61.60 ft | on 05-26-2015 |
| 2. | 61.35 ft | on 09-19-1983 |
| 3. | 61.26 ft | on 04-18-2016 |
| 4. | 61.15 ft | on 03-04-1992 |
| 5. | 60.78 ft | on 11-17-2003 |
| 6. | 60.00 ft | on 08-27-2017 |
| 7. | 59.45 ft | on 10-18-1994 |
| 8. | 59.00 ft | on 04-18-2016 |
| 9. | 58.27 ft | on 01-09-2012 |
| 10. | 56.85 ft | on 09-11-1998 |
| 11. | 56.73 ft | on 06-09-2001 |
Gauge Photos
No Images Found
Collaborative Agencies
The National Weather Service prepares its forecasts and other services in collaboration with agencies like the US Geological Survey, US Bureau of Reclamation, US Army Corps of Engineers, Natural Resource Conservation Service, National Park Service, ALERT Users Group, Bureau of Indian Affairs, and many state and local emergency managers across the country. For details, please click here.
Resources
Hydrologic Resource Links
Additional Resource Links
- NWS Precipitation and River Forecasting
- Area Hydrographs
- West Gulf River Forecast Center
- Harris County Flood Control District
- Brazoria County Office of Emergency Management
- Fort Bend County
- State of Texas Office of Emergency Management
- Trinity River Authority
- San Jacinto River Authority
- Brazos River Authority
- Lower Colroado River Authority
- Lavaca-Navidad River Authority
- Snow Information