Latitude/Longitude Disclaimer: The gauge location shown in the above map is the approximate location based on the latitude/longitude coordinates provided to the NWS by the gauge owner.
Gauge Information
Map Overlays
FEMA's National Flood Hazard Layers not showing?
Why aren't the FEMA National Flood Hazard Layers showing on the ESRI Map?
Possible reasons:
There are no FEMA National Flood Hazard Layers for the location which you are viewing on ESRI Maps.
The FEMA Web Mapping Service (WMS) is down.
Note: Your zoom level may have changed. ESRI's zoom levels must be between 14 and 16 to show National Flood Hazard layers.
Note: Your zoom level may have changed. ESRI's zoom levels must be between 14 and 16 to show National Flood Hazard layers.
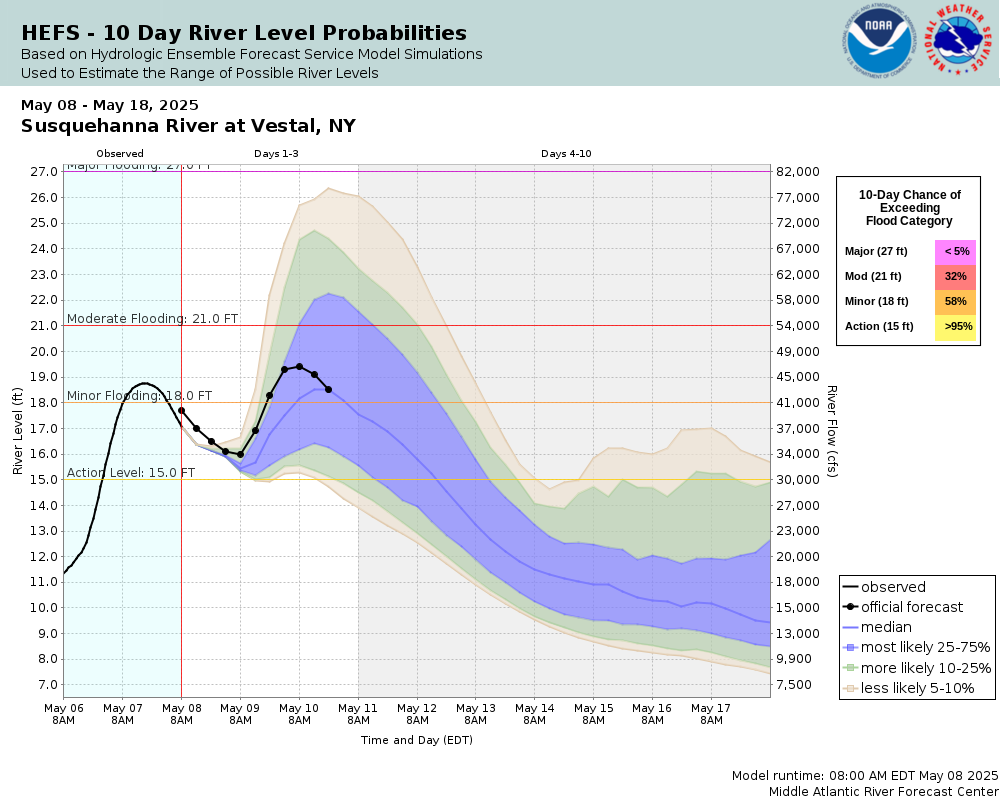
Flood Categories (in feet)
Major Flood Stage:
27
Moderate Flood Stage:
21
Flood Stage:
18
Action Stage:
15
Low Stage (in feet):
-9999
Historic Crests
(1) 35.26 ft on 09/08/2011
(2) 33.66 ft on 06/28/2006
(3) 30.50 ft on 03/18/1936
(4) 29.14 ft on 04/03/2005
(5) 27.86 ft on 01/20/1996 Show More Historic Crests
(P): Preliminary values subject to further review.
Recent Crests
(1) 22.41 ft on 12/19/2023 (P)
(2) 21.13 ft on 05/01/2023 (P)
(3) 18.43 ft on 02/19/2022
(4) 22.24 ft on 10/27/2021
(5) 25.26 ft on 12/25/2020 Show More Recent Crests
(P): Preliminary values subject to further review.
Low Water Records Currently none available.
Graphical representation of flood inundation for NWS flood categories are based on steady state hydraulic modeling of water surface elevations for incremented discharges. Map shows approximate inundation areas for given water surface elevations and should not be used for navigation or permitting or other legal purposes, but strictly as a planning reference tool.
Site-specific information: A report discussing the technical aspects of these maps can be found
here. These maps represent unobstructed flow conditions and may be
unrepresentative when ice jams and/or debris are in place.
Extended rating: Rating Curve Extension - The Rating Curve Extension is calculated by using either a linear, logarithmic, or hydraulic technique to extend the rating curve above the currently established relationship between stage and flow.
Flood Impacts
If you notice any errors in the below information, please contact our Webmaster
35.25
Flood of record. Widespread and catastrophic flood devastation in Johnson City, Westover, Endwell, Endicott, West Corners and Vestal extending into Tioga county. This was the flood crest of September 2011.
33.65
Extensive and severe flooding in Vestal, Westover, West Corners, Johnson City and the Fairmont Park neighborhood of Endwell. This was the flood level of June 2006.
30.5
Widespread flooding along George F. Highway from Hooper Road east to Johnson City. Flood waters approach Main Street in the Scarborough Drive and Chaumont Drive areas of Endwell. Flood waters overspread all low lying areas to the north of Route 434 including homes and businesses across from University Park Mall, and along old Vestal Road. Most of Route 17 and 434 are flooded west of the Vestal town offices. This was the flood crest of March 1936.
29.5
Flood waters inundate the entire Castle Gardens neighborhood including the senior living center. Parts of Route 17 and Route 434 begin to flood from Town of Vestal to near the Apalachin exit in Tioga county. This was the flood level of April 2005.
28
Flood waters inundate parking lots in Town Square Mall, Old Vestal Road under the railroad bridge, Meadow Lane and the Binghamton-Johnson City sewage treatment plant. The Little Choconut Creek in Westover floods.
27
Major flood stage. Flooding inundates residences in Castle Gardens on Crest Street. Flooding begins to affect Westview Drive, Garden Lane and both sides of North Road in Vestal. Flooding also affects Ormond Street, Ardmore and River Drive in West Corners, from Johnson City to Vestal. Flooding affects Poplar, Oak, Birch, Woodland and River Roads. This was the flood level of December 1983.
26.6
Severe flood inundation affects areas from Argonne and Shady Drive to Verdun Avenue. Route 17C from Exit 69 to Harry L. Drive covered by flood waters. Major flooding occurs on Old Vestal Road from African Road to Sycamore. Castle Gardens Road at Route 17 floods. West end of River Road floods. This was the flood of March 1979.
25.5
Residences and businesses on Kent, Verdun, Davis, and Fairmont Avenues, Shady, Chaumont and Scarborough Drive are inundated. Castle Gardens residences begin to flood at the end of Crest Street, River Street and North Road. This was the flood of April 1993.
24.5
Flooding increases and starts to affect businesses near Old Vestal and African Roads. Flood waters approach Boland Drive in Johnson City.
23
Flooding begins at the intersection of Old Vestal and African Roads.
22
Moore Park in Vestal floods. Flooding to first floor level begins at the low ends of Davis Avenue, Shady Drive, Verdun Avenue and Fairmont in Endwell.
21
Moderate flood stage.
20.5
Cellars flood on Argonne Drive in Endwell.
18
Flood stage. The river overflows banks and lowland flooding begins within the flood plain.
The National Weather Service prepares its forecasts and other services in collaboration with agencies like the US Geological Survey, US Bureau of Reclamation, US Army Corps of Engineers, Natural Resource Conservation Service, National Park Service, ALERT Users Group, Bureau of Indian Affairs, and many state and local emergency managers across the country. For details, please click here.
Graphical representation of flood inundation for NWS flood categories are based on steady state hydraulic modeling of water surface elevations for incremented discharges. Map shows approximate inundation areas for given water surface elevations and should not be used for navigation or permitting or other legal purposes, but strictly as a planning reference tool.