Latitude/Longitude Disclaimer: The gauge location shown in the above map is the approximate location based on the latitude/longitude coordinates provided to the NWS by the gauge owner.
Gauge Information
Map Overlays
FEMA's National Flood Hazard Layers not showing?
Why aren't the FEMA National Flood Hazard Layers showing on the ESRI Map?
Possible reasons:
There are no FEMA National Flood Hazard Layers for the location which you are viewing on ESRI Maps.
The FEMA Web Mapping Service (WMS) is down.
Note: Your zoom level may have changed. ESRI's zoom levels must be between 14 and 16 to show National Flood Hazard layers.
Note: Your zoom level may have changed. ESRI's zoom levels must be between 14 and 16 to show National Flood Hazard layers.
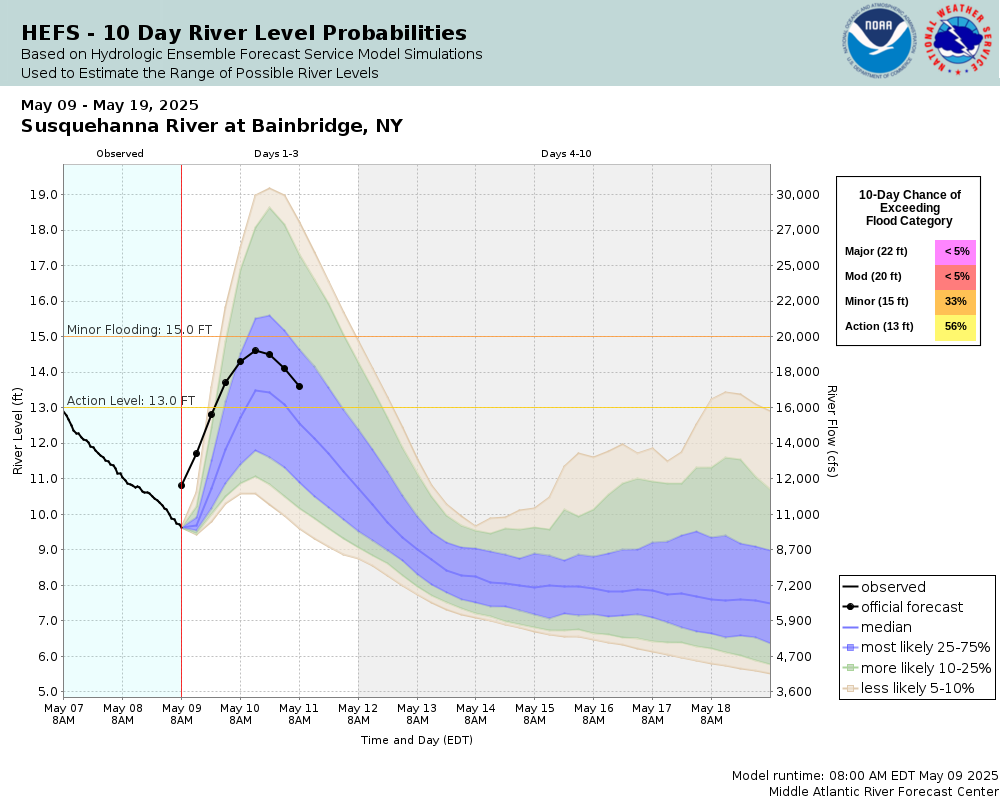
Flood Categories (in feet)
Major Flood Stage:
22
Moderate Flood Stage:
20
Flood Stage:
15
Action Stage:
13
Low Stage (in feet):
-9999
Historic Crests
(1) 27.05 ft on 06/29/2006
(2) 26.20 ft on 09/08/2011
(3) 23.10 ft on 03/29/1914
(4) 22.20 ft on 03/15/1977
(5) 22.10 ft on 03/01/1910 Show More Historic Crests
(P): Preliminary values subject to further review.
Recent Crests
(1) 16.84 ft on 12/19/2023 (P)
(2) 16.52 ft on 04/09/2022
(3) 15.97 ft on 12/26/2020
(4) 17.36 ft on 04/08/2017
(5) 15.09 ft on 05/17/2014 Show More Recent Crests
(P): Preliminary values subject to further review.
Low Water Records Currently none available.
Graphical representation of flood inundation for NWS flood categories are based on steady state hydraulic modeling of water surface elevations for incremented discharges. Map shows approximate inundation areas for given water surface elevations and should not be used for navigation or permitting or other legal purposes, but strictly as a planning reference tool.
Site-specific information: A report discussing the technical aspects of these maps can be found
here. These maps represent unobstructed flow conditions and may be
unrepresentative when ice jams and/or debris are in place.
Extended rating: Rating Curve Extension - The Rating Curve Extension is calculated by using either a linear, logarithmic, or hydraulic technique to extend the rating curve above the currently established relationship between stage and flow.
Flood Impacts
If you notice any errors in the below information, please contact our Webmaster
27.05
This was the record flood of June 2006. Flooding was widespread and severe in Sidney and Bainbridge.
26.5
The East-West Main Street intersection and Press Building in Sidney begins to flood.
26.2
Widespread severe flood damage caused by the September 2011 flood.
26
The water treatment building and Grand Street in Sidney are inundated.
25
Flood waters spread to Clinton Street, Grand Street, Avery Street, Liberty Street and Pleasant Street in Sidney. The Sidney central fire station takes on water.
24
River Street and portions of East Main, and North Main Street in Bainbridge flood. Severe flooding occurs in Sidney. Sherman Avenue, Bridge Street, Willow Street and Cross Street flood. Scoville-Meno car dealership is impacted by flood waters.
23
Portions of Route 7 between County Route 38 and Dingman Hill Road near Bainbridge are flooded. Flood waters reach the American Legion and inundate Adams, Gilbert, Weir and Union Streets in Sidney.
22
Major Flood Stage. Flooding inundates County Route 39, Walnut Street, Front Street, and Oak Avenue in Bainbridge.
21
Water floods the westbound entrance ramp of I-88 at Bainbridge. Camp Street and Gilbert Street in Sidney are flooded.
20
Moderate Flood Stage. Water is 2 to 3 feet deep on Willow Street Extension in Sidney. Flood waters reach Camp Street, Winegard Street and Maple Avenue in sidney. The NYSEG substation and telephone buildings flood.
19
Flooding develops near Front Street and Walnut Avenue in Bainbridge. Street level to first floor flooding occurs on Railroad Avenue, Colgrove Street and lower portions of River Street in Sidney.
18.5
Minor flooding begins to impact the ball fields, trails and buildings on Willow Street Extension in Sidney.
17
Flooding occurs in the low lying areas across the river from Bainbridge.
15
Minor flooding occurs in fields and low lands near the river from Sidney to Bainbridge.
The National Weather Service prepares its forecasts and other services in collaboration with agencies like the US Geological Survey, US Bureau of Reclamation, US Army Corps of Engineers, Natural Resource Conservation Service, National Park Service, ALERT Users Group, Bureau of Indian Affairs, and many state and local emergency managers across the country. For details, please click here.
Graphical representation of flood inundation for NWS flood categories are based on steady state hydraulic modeling of water surface elevations for incremented discharges. Map shows approximate inundation areas for given water surface elevations and should not be used for navigation or permitting or other legal purposes, but strictly as a planning reference tool.