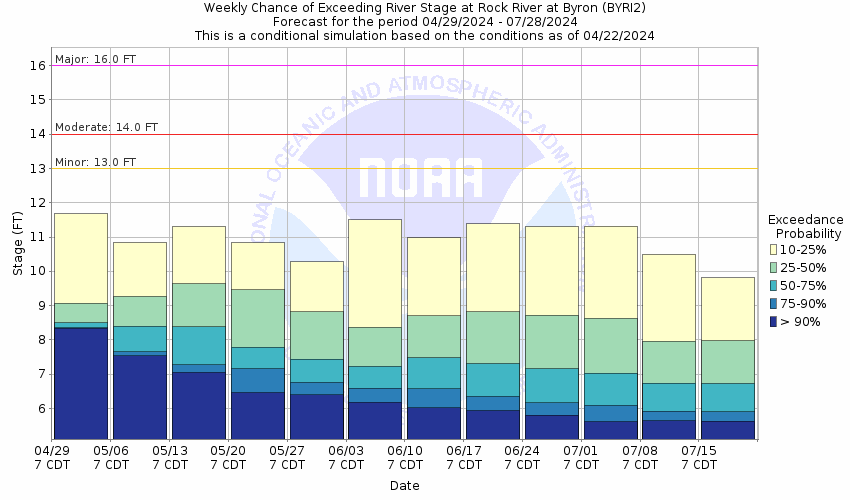
Skip Navigation Link weather.gov  
NOAA logo - Click to go to the NOAA homepage National Weather Service NWS logo - Click to go to the NWS homepage
Advanced Hydrologic Prediction Service
Image background of Navigation bar Left
Navigation Bar End Cap


This probabilistic forecast is issued by the North Central River Forecast Center.
tab left off Hydrograph tab right off tab left off River at a Glance tab right off tab left off Download tab right off tab left on tab right on
About this graph
Forecasts for the Rock River at Byron are issued as needed during times of high water, but are not routinely available.
Return to Area Map

Downstream Gauge Downstream Gauge - at Dixon
Zoom Level:15
Flood Categories (in feet)
Major Flood Stage: 16
Moderate Flood Stage: 14
Flood Stage: 13
Action Stage: 10.5
Low Stage (in feet): 4

Historic Crests
(1) 17.80 ft on 04/20/1973
(2) 17.08 ft on 04/20/2013
(3) 16.64 ft on 03/16/2019
(4) 16.50 ft on 07/25/2010
(5) 16.12 ft on 06/14/2000
Show More Historic Crests

(P): Preliminary values subject to further review.

Recent Crests
(1) 13.11 ft on 05/18/2020
(2) 13.06 ft on 03/29/2020
(3) 14.42 ft on 10/04/2019
(4) 13.53 ft on 09/15/2019
(5) 13.00 ft on 05/31/2019
Show More Recent Crests

(P): Preliminary values subject to further review.

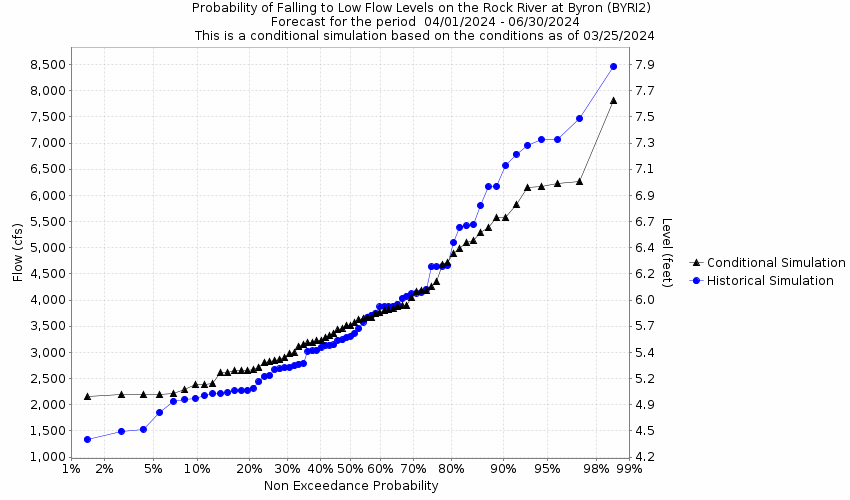
Low Water Records
(1) 4.33 ft on 09/09/2003
(2) 4.36 ft on 09/21/2012
(3) 4.44 ft on 10/16/2005
KML Image
Gauge LocationGauge Map Marker
Disclaimer
Latitude/Longitude Disclaimer: The gauge location shown in the above map is the approximate location based on the latitude/longitude coordinates provided to the NWS by the gauge owner.
Flood Impacts & Photos Collapse
If you notice any errors in the below information, please contact our Webmaster
17 Water threatens structures at the water treatment plant in Byron.
16.5 Numerous residences are threatened between IL-2 and the river just northeast of Byron. River Road is threatened near the river just south of Byron.
16 The MercyHealth Clinic is threatened along Kysor Drive in Byron.
15.5 Water threatens lower sections of the water treatment plant property in Byron. Water threatens IL-2 west of Byron.
13.5 Numerous low-lying structures downstream of Byron are flooded.
13 Low-lying structures downstream of Byron are threatened.
12 Water inundates yards of several houses along River Road near Byron. Low-lying portions of Hamas Park and Sunshine Park are inundated.
10.5 Water begins to affect low-lying areas along the river near Byron.
Low Water Impacts Collapse
If you notice any errors in the below information, please contact our Webmaster
4.0 Approximate stage of the 1-in-10 annual chance flow (7-day average).

Other Real-time and/or Archive Data Sources:

Additional Information Collapse
How much forecast precipitation was used for the current river forecast?
How low could the river get?
Collaborative Agencies Collapse
The National Weather Service prepares its forecasts and other services in collaboration with agencies like the US Geological Survey, US Bureau of Reclamation, US Army Corps of Engineers, Natural Resource Conservation Service, National Park Service, ALERT Users Group, Bureau of Indian Affairs, and many state and local emergency managers across the country. For details, please click here.
NWS Information
National Weather Service
Chicago Weather Forecast Office
333 W. University Dr.
Romeoville, IL 60446
(815) 834-1435
Ask Questions/Webmaster
Page last modified: 2-Nov-2020 7:29 PM
Disclaimer
Credits
Glossary
Privacy Policy
About Us
Career Opportunities