Historic Crests
(1) 20.60 ft on 01/22/1959
(2) 17.60 ft on 10/17/1954
(3) 17.50 ft on 07/17/1958
(4) 17.00 ft on 05/28/1946
(5) 17.00 ft on 01/28/1952
(6) 16.80 ft on 02/11/1959
(7) 16.70 ft on 12/31/1942
(8) 16.00 ft on 03/11/1964
(9) 15.80 ft on 03/07/1964
(10) 15.00 ft on 04/01/1960
(P): Preliminary values subject to further review.
Recent Crests
(1) 16.00 ft on 03/11/1964
(2) 15.80 ft on 03/07/1964
(3) 15.00 ft on 04/01/1960
(4) 16.80 ft on 02/11/1959
(5) 20.60 ft on 01/22/1959
(6) 17.50 ft on 07/17/1958
(7) 17.60 ft on 10/17/1954
(8) 17.00 ft on 01/28/1952
(9) 17.00 ft on 05/28/1946
(10) 16.70 ft on 12/31/1942
(P): Preliminary values subject to further review.
Latitude/Longitude Disclaimer: The gauge location shown in the above map
is the approximate location based on the latitude/longitude coordinates
provided to the NWS by the gauge owner.
Flood Impacts & Photos
If you notice any errors in the below information, please contact our Webmaster
24
Flood of Record from March 1913. Stage is estimated based on flow from original gage site.
22.7
Flood waters reach railroad tracks on right downstream bank across the river from the water company.
20.6
Hundreds of homes and businesses flooded in New Castle.
19.5
Water company out of operation unless sandbags have been installed.
18.6
Water reaches the floor level at Water Company Pumping Station.
18.25
Water reaches the gage house tabletop. Gage out of service.
18
Basements are flooded in low lying areas of New Castle.
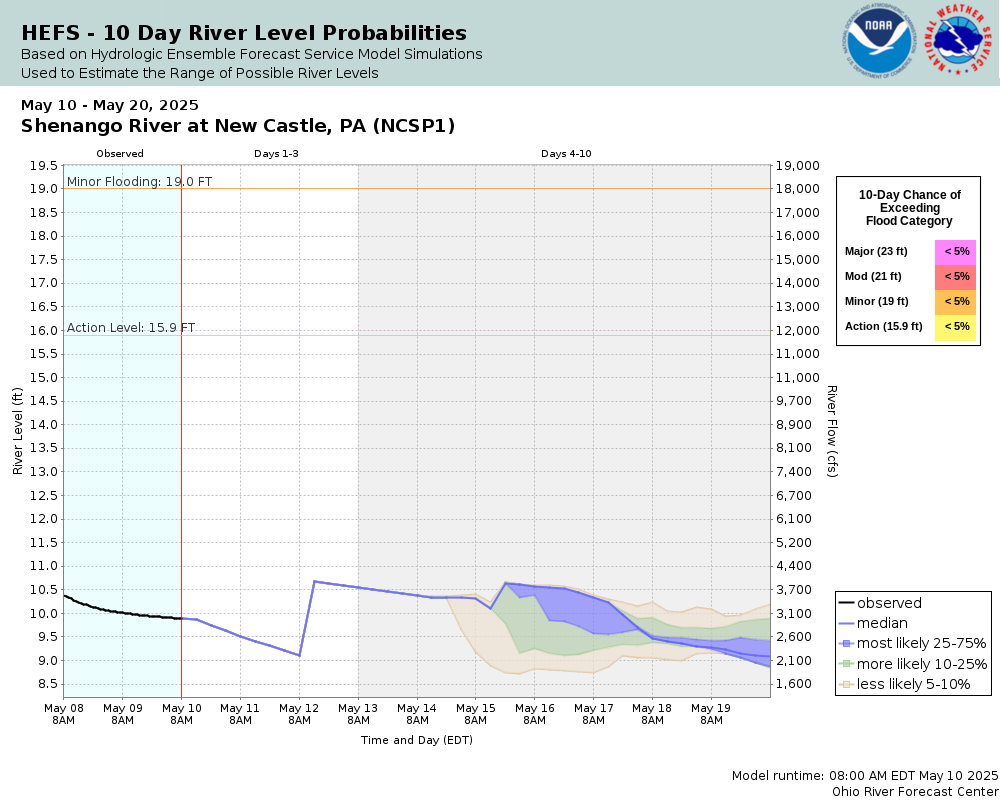
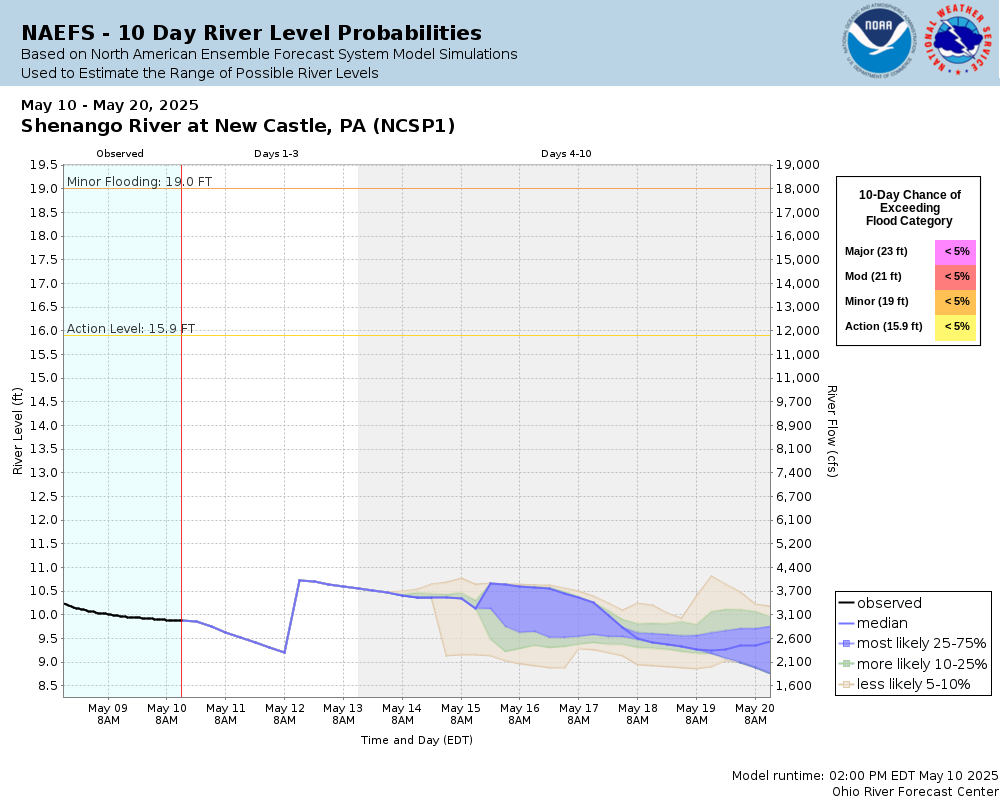
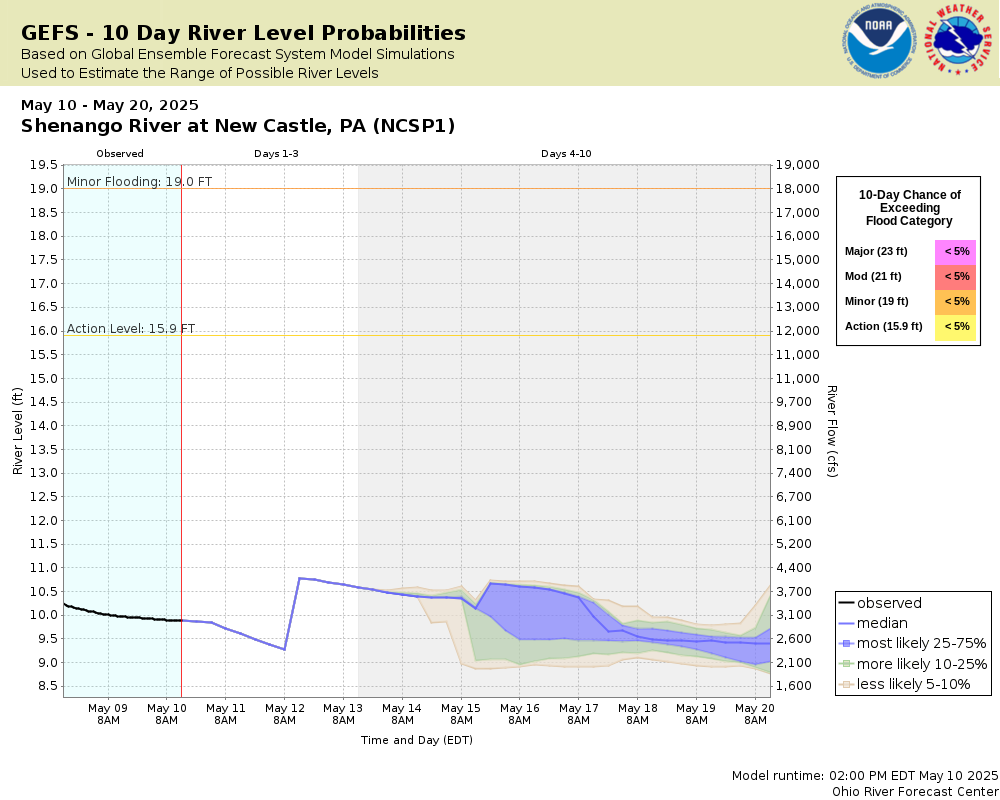
Potential River Levels Used to Estimate the Chance of Flooding and
the Range of Possible River Levels
10 Day (HEFS)
10 Day (NAEFS)
10 Day (GEFS)
Note: Use the official hydrograph at the top of this web page
for river levels within the next 72 hours.
Collaborative Agencies
The National Weather Service prepares its forecasts and other services in collaboration with agencies like the US Geological Survey, US Bureau of Reclamation, US Army Corps of Engineers, Natural Resource Conservation Service, National Park Service, ALERT Users Group, Bureau of Indian Affairs, and many state and local emergency managers across the country. For details, please click here.
NWS Information
National Weather Service
Pittsburgh Weather Forecast Office
192 Shafer Road
Moon Township, PA 15108
(412) 262-1591 Ask Questions/Webmaster
Page last modified: 2-Nov-2020 7:30 PM