Skip Navigation Link weather.gov  
NOAA logo - Click to go to the NOAA homepage National Weather Service NWS logo - Click to go to the NWS homepage
Advanced Hydrologic Prediction Service
Image background of Navigation bar Left
Navigation Bar End Cap

Red River At Coushatta (CSHL1)

Return to Top
NOTE: River forecasts for this location take into account past precipitation and the precipitation amounts expected approximately 24 hours into the future from the forecast issuance time.
Flood Stage: 31 Feet
Latest Stage: 25.24
Current Warnings/Statements/Advisories:None currently.
at Coushatta
Stage (ft)Flow (kcfs)Observed: 25.09 ft at 4:00AM Dec 02, 2023Observed: 25.17 ft at 5:00AM Dec 02, 2023Observed: 25.14 ft at 6:00AM Dec 02, 2023Observed: 25.13 ft at 7:00AM Dec 02, 2023Observed: 25.12 ft at 8:00AM Dec 02, 2023Observed: 25.11 ft at 9:00AM Dec 02, 2023Observed: 25.11 ft at 10:00AM Dec 02, 2023Observed: 24.99 ft at 11:00AM Dec 02, 2023Observed: 25.1 ft at 12:00PM Dec 02, 2023Observed: 25 ft at 1:00PM Dec 02, 2023Observed: 24.97 ft at 2:00PM Dec 02, 2023Observed: 25.04 ft at 3:00PM Dec 02, 2023Observed: 25.05 ft at 4:00PM Dec 02, 2023Observed: 25.01 ft at 5:00PM Dec 02, 2023Observed: 25.01 ft at 6:00PM Dec 02, 2023Observed: 25.02 ft at 7:00PM Dec 02, 2023Observed: 24.97 ft at 8:00PM Dec 02, 2023Observed: 25 ft at 9:00PM Dec 02, 2023Observed: 24.99 ft at 10:00PM Dec 02, 2023Observed: 24.95 ft at 11:00PM Dec 02, 2023Observed: 24.92 ft at 12:00AM Dec 03, 2023Observed: 24.94 ft at 1:00AM Dec 03, 2023Observed: 24.93 ft at 2:00AM Dec 03, 2023Observed: 24.92 ft at 3:00AM Dec 03, 2023Observed: 24.91 ft at 4:00AM Dec 03, 2023Observed: 24.89 ft at 5:00AM Dec 03, 2023Observed: 24.88 ft at 6:00AM Dec 03, 2023Observed: 24.87 ft at 7:00AM Dec 03, 2023Observed: 24.86 ft at 8:00AM Dec 03, 2023Observed: 24.84 ft at 9:00AM Dec 03, 2023Observed: 24.83 ft at 10:00AM Dec 03, 2023Observed: 24.82 ft at 11:00AM Dec 03, 2023Observed: 24.69 ft at 12:00PM Dec 03, 2023Observed: 24.7 ft at 1:00PM Dec 03, 2023Observed: 24.7 ft at 2:00PM Dec 03, 2023Observed: 24.73 ft at 3:00PM Dec 03, 2023Observed: 24.76 ft at 4:00PM Dec 03, 2023Observed: 24.88 ft at 5:00PM Dec 03, 2023Observed: 24.9 ft at 6:00PM Dec 03, 2023Observed: 24.91 ft at 7:00PM Dec 03, 2023Observed: 24.94 ft at 8:00PM Dec 03, 2023Observed: 24.95 ft at 9:00PM Dec 03, 2023Observed: 24.97 ft at 10:00PM Dec 03, 2023Observed: 25.05 ft at 11:00PM Dec 03, 2023Observed: 25.03 ft at 12:00AM Dec 04, 2023Observed: 25.18 ft at 1:00AM Dec 04, 2023Observed: 25.23 ft at 2:00AM Dec 04, 2023Observed: 25.19 ft at 3:00AM Dec 04, 2023Observed: 25.25 ft at 4:00AM Dec 04, 2023Observed: 25.38 ft at 5:00AM Dec 04, 2023Observed: 25.33 ft at 6:00AM Dec 04, 2023Highest Observation: 25.48 ft at 7:00AM Dec 04, 2023Observed: 25.45 ft at 8:00AM Dec 04, 2023Observed: 25.34 ft at 9:00AM Dec 04, 2023Observed: 25.3 ft at 10:00AM Dec 04, 2023Observed: 25.29 ft at 11:00AM Dec 04, 2023Observed: 25.28 ft at 12:00PM Dec 04, 2023Observed: 25.24 ft at 1:00PM Dec 04, 2023Observed: 25.25 ft at 2:00PM Dec 04, 2023Observed: 25.27 ft at 3:00PM Dec 04, 2023Observed: 25.33 ft at 4:00PM Dec 04, 2023Observed: 25.34 ft at 5:00PM Dec 04, 2023Observed: 25.33 ft at 6:00PM Dec 04, 2023Observed: 25.32 ft at 7:00PM Dec 04, 2023Observed: 25.31 ft at 8:00PM Dec 04, 2023Observed: 25.3 ft at 9:00PM Dec 04, 2023Observed: 25.28 ft at 10:00PM Dec 04, 2023Observed: 25.28 ft at 11:00PM Dec 04, 2023Observed: 25.26 ft at 12:00AM Dec 05, 2023Observed: 25.24 ft at 1:00AM Dec 05, 2023Observed: 25.24 ft at 2:00AM Dec 05, 2023Highest Forecast: 25.2 ft 6:00AM Dec 05, 2023Highest Forecast: 25.2 ft 12:00PM Dec 05, 2023Highest Forecast: 25.2 ft 6:00PM Dec 05, 2023Highest Forecast: 25.2 ft 12:00AM Dec 06, 2023Highest Forecast: 25.2 ft 6:00AM Dec 06, 2023Highest Forecast: 25.2 ft 12:00PM Dec 06, 2023Highest Forecast: 25.2 ft 6:00PM Dec 06, 2023Highest Forecast: 25.2 ft 12:00AM Dec 07, 2023Highest Forecast: 25.2 ft 6:00AM Dec 07, 2023Highest Forecast: 25.2 ft 12:00PM Dec 07, 2023Highest Forecast: 25.2 ft 6:00PM Dec 07, 2023Highest Forecast: 25.2 ft 12:00AM Dec 08, 2023Highest Forecast: 25.2 ft 6:00AM Dec 08, 2023Forecast: 25.1 ft 12:00PM Dec 08, 2023Forecast: 25.1 ft 6:00PM Dec 08, 2023Forecast: 25.1 ft 12:00AM Dec 09, 2023Forecast: 25.1 ft 6:00AM Dec 09, 2023US Army Corps of EngineersCSHL1(plotting HGIRG) Graph Created (3:06AM Dec 5, 2023)ObservedForecast (issued 8:47AM Dec 4)Latest observed value: 25.24 ft at 2:00 AM CST 5-Dec-2023. Flood Stage is 31 ft
KML Image
Gauge LocationGauge Map Marker
Latitude/Longitude Disclaimer: The gauge location shown in the above map is the approximate location based on the latitude/longitude coordinates provided to the NWS by the gauge owner.
Flood Impacts

If you notice any errors in the below information, please contact our Webmaster

38
Major and near-record flooding occurs. Several secondary roads flood and must be closed. Louisiana highway 515 closed due to backwater flooding into Loggy Bayou. Additionally, Lake Bistineau will rise above flood pool stage due to backwater. Louisiana Highway 480 will be closed as well. Cattle and equipment should be moved to higher ground well away from levee systems. Expect extensive flooding in and near levee systems.
35
Moderate flooding occurs. Severe backwater flooding occurs from the confluence of the Red River with Loggy Bayou through the lower Flat River and Red Chute Bayou in southern Bossier Parish. Cattle and equipment should be moved to higher ground away from levees.
34
Moderate flooding occurs. Severe backwater flooding occurs from the confluence of the Red River with Loggy Bayou through the lower Flat River and Red Chute Bayou in southern Bossier Parish. Cattle and equipment should be moved to higher ground away from levees.
33
Moderate flooding occurs. Severe backwater flooding occurs from the confluence of the Red River with Loggy Bayou through the lower Flat River and Red Chute Bayou in southern Bossier Parish. Cattle and equipment should be moved to higher ground away from levees.
31
Minor flooding occurs. Minor backwater flooding occurs from the confluence or the Red River with Loggy Bayou as well as up through the lower Flat River and lower Red Chute Bayou in southern Bossier Parish. Livestock and equipment should be moved to higher ground.
29
Some minor backwater flooding occurs, from the confluence of the Red River with Loggy Bayou, to below Lake Bistineau.
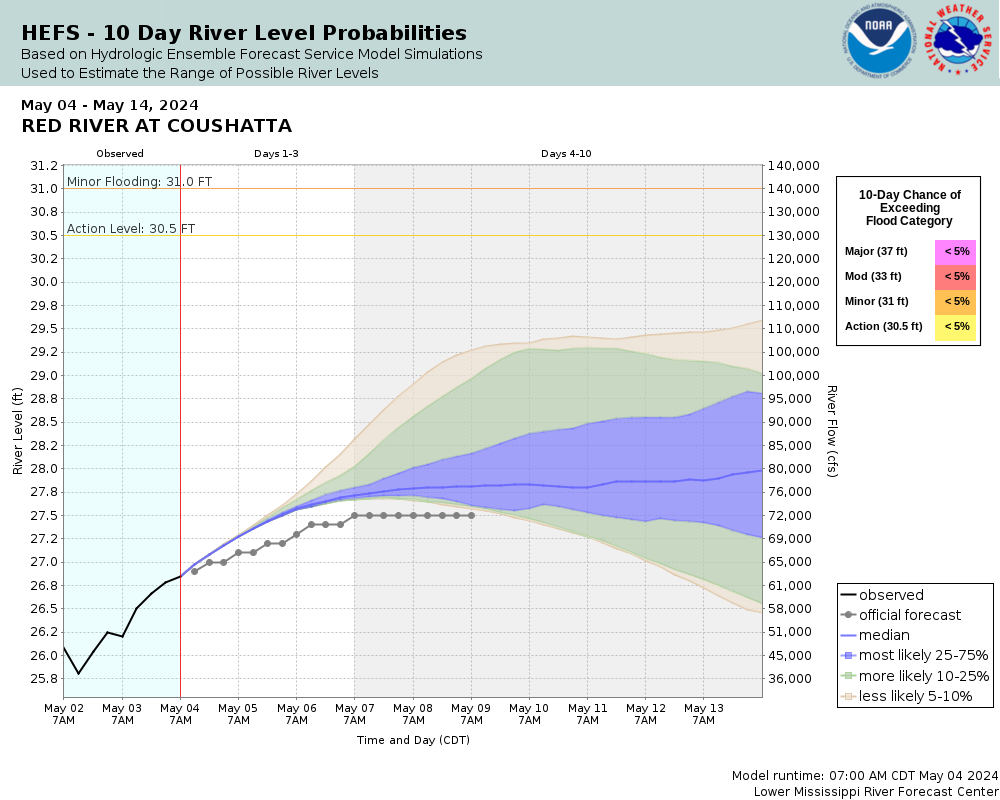
Flood Categories (in feet)
Major Flood Stage: 37
Moderate Flood Stage: 33
Flood Stage: 31
Action Stage: 30.5
Low Stage (in feet): -9999

Historic Crests
(1) 39.90 ft on 04/07/1945
(2) 39.20 ft on 06/05/1892
(3) 38.83 ft on 06/11/2015
(4) 38.45 ft on 05/09/1958
(5) 38.10 ft on 02/15/1890
Show More Historic Crests

(P): Preliminary values subject to further review.

Recent Crests
(1) 33.29 ft on 05/14/2019
(2) 34.50 ft on 03/05/2018
(3) 31.02 ft on 05/11/2016
(4) 33.56 ft on 05/06/2016
(5) 36.87 ft on 03/16/2016
Show More Recent Crests

(P): Preliminary values subject to further review.

Low Water Records
(1) -1.40 ft on 11/15/1992
(2) -0.80 ft on 09/10/1993
(3) 0.90 ft on 10/02/1993

Observed and Forecast Stages

Observed Data:
Date (UTC)
Stage
Flow
12/05 08:00
25.24 ft
16.4 kcfs
12/05 07:00
25.24 ft
16.4 kcfs
12/05 06:00
25.26 ft
17.1 kcfs
12/05 05:00
25.28 ft
17.8 kcfs
12/05 04:00
25.28 ft
17.8 kcfs
12/05 03:00
25.3 ft
18.6 kcfs
12/05 02:00
25.31 ft
19 kcfs
12/05 01:00
25.32 ft
19.4 kcfs
12/05 00:00
25.33 ft
19.8 kcfs
12/04 23:00
25.34 ft
20.2 kcfs
12/04 22:00
25.33 ft
19.8 kcfs
12/04 21:00
25.27 ft
17.5 kcfs
12/04 20:00
25.25 ft
16.8 kcfs
12/04 19:00
25.24 ft
16.4 kcfs
12/04 18:00
25.28 ft
17.8 kcfs
12/04 17:00
25.29 ft
18.2 kcfs
12/04 16:00
25.3 ft
18.6 kcfs
12/04 15:00
25.34 ft
20.2 kcfs
12/04 14:00
25.45 ft
25.3 kcfs
12/04 13:00
25.48 ft
26.9 kcfs
12/04 12:00
25.33 ft
19.8 kcfs
12/04 11:00
25.38 ft
21.9 kcfs
12/04 10:00
25.25 ft
16.8 kcfs
12/04 09:00
25.19 ft
14.8 kcfs
12/04 08:00
25.23 ft
16.1 kcfs
12/04 07:00
25.18 ft
14.5 kcfs
12/04 06:00
25.03 ft
10.6 kcfs
12/04 05:00
25.05 ft
11.1 kcfs
12/04 04:00
24.97 ft
9.27 kcfs
12/04 03:00
24.95 ft
8.81 kcfs
12/04 02:00
24.94 ft
8.58 kcfs
12/04 01:00
24.91 ft
7.95 kcfs
12/04 00:00
24.9 ft
7.75 kcfs
12/03 23:00
24.88 ft
7.37 kcfs
12/03 22:00
24.76 ft
3.12 kcfs
12/03 21:00
24.73 ft
1.91 kcfs
12/03 20:00
24.7 ft
1.16 kcfs
12/03 19:00
24.7 ft
1.16 kcfs
12/03 18:00
24.69 ft
0.989 kcfs
12/03 17:00
24.82 ft
6.32 kcfs
12/03 16:00
24.83 ft
6.48 kcfs
12/03 15:00
24.84 ft
6.65 kcfs
12/03 14:00
24.86 ft
7 kcfs
12/03 13:00
24.87 ft
7.18 kcfs
12/03 12:00
24.88 ft
7.37 kcfs
12/03 11:00
24.89 ft
7.56 kcfs
12/03 10:00
24.91 ft
7.95 kcfs
12/03 09:00
24.92 ft
8.16 kcfs
12/03 08:00
24.93 ft
8.37 kcfs
12/03 07:00
24.94 ft
8.58 kcfs
12/03 06:00
24.92 ft
8.16 kcfs
12/03 05:00
24.95 ft
8.81 kcfs
12/03 04:00
24.99 ft
9.75 kcfs
12/03 03:00
25 ft
10 kcfs
12/03 02:00
24.97 ft
9.27 kcfs
12/03 01:00
25.02 ft
10.4 kcfs
12/03 00:00
25.01 ft
10.2 kcfs
12/02 23:00
25.01 ft
10.2 kcfs
12/02 22:00
25.05 ft
11.1 kcfs
12/02 21:00
25.04 ft
10.9 kcfs
12/02 20:00
24.97 ft
9.27 kcfs
12/02 19:00
25 ft
10 kcfs
12/02 18:00
25.1 ft
12.3 kcfs
12/02 17:00
24.99 ft
9.75 kcfs
12/02 16:00
25.11 ft
12.6 kcfs
12/02 15:00
25.11 ft
12.6 kcfs
12/02 14:00
25.12 ft
12.8 kcfs
12/02 13:00
25.13 ft
13.1 kcfs
12/02 12:00
25.14 ft
13.4 kcfs
12/02 11:00
25.17 ft
14.2 kcfs
12/02 10:00
25.09 ft
12.1 kcfs
12/02 09:00
25.02 ft
10.4 kcfs
12/02 08:00
25.11 ft
12.6 kcfs
12/02 07:00
24.98 ft
9.51 kcfs
12/02 06:00
25.13 ft
13.1 kcfs
12/02 05:00
25.07 ft
11.6 kcfs
12/02 04:00
25.07 ft
11.6 kcfs
12/02 03:00
25.18 ft
14.5 kcfs
12/02 02:00
25.19 ft
14.8 kcfs
12/02 01:00
25.2 ft
15.1 kcfs
12/02 00:00
25.2 ft
15.1 kcfs
12/01 23:00
25.2 ft
15.1 kcfs
12/01 22:00
25.21 ft
15.5 kcfs
12/01 21:00
25.2 ft
15.1 kcfs
12/01 20:00
25.22 ft
15.8 kcfs
12/01 19:00
25.22 ft
15.8 kcfs
12/01 18:00
25.23 ft
16.1 kcfs
12/01 17:00
25.24 ft
16.4 kcfs
12/01 16:00
25.22 ft
15.8 kcfs
12/01 15:00
25.26 ft
17.1 kcfs
12/01 14:00
25.29 ft
18.2 kcfs
12/01 13:00
25.26 ft
17.1 kcfs
12/01 12:00
25.24 ft
16.4 kcfs
12/01 11:00
25.22 ft
15.8 kcfs
12/01 10:00
25.21 ft
15.5 kcfs
12/01 09:00
25.19 ft
14.8 kcfs
12/01 08:00
25.18 ft
14.5 kcfs
12/01 07:00
25.16 ft
13.9 kcfs
12/01 06:00
25.12 ft
12.8 kcfs
12/01 05:00
25.07 ft
11.6 kcfs
12/01 04:00
24.93 ft
8.37 kcfs
12/01 03:00
25.08 ft
11.8 kcfs
12/01 02:00
25.01 ft
10.2 kcfs
12/01 01:00
24.97 ft
9.27 kcfs
12/01 00:00
24.95 ft
8.81 kcfs
11/30 23:00
24.94 ft
8.58 kcfs
11/30 22:00
24.94 ft
8.58 kcfs
11/30 21:00
24.95 ft
8.81 kcfs
11/30 20:00
25.03 ft
10.6 kcfs
11/30 19:00
24.97 ft
9.27 kcfs
11/30 18:00
25 ft
10 kcfs
11/30 17:00
25.02 ft
10.4 kcfs
11/30 16:00
24.98 ft
9.51 kcfs
11/30 15:00
25.02 ft
10.4 kcfs
11/30 14:00
24.96 ft
9.03 kcfs
11/30 13:00
24.83 ft
6.48 kcfs
11/30 12:00
24.93 ft
8.37 kcfs
11/30 11:00
25.03 ft
10.6 kcfs
11/30 10:00
25.04 ft
10.9 kcfs
11/30 09:00
25.03 ft
10.6 kcfs
11/30 08:00
24.98 ft
9.51 kcfs
11/30 07:00
24.99 ft
9.75 kcfs
11/30 06:00
25.02 ft
10.4 kcfs
11/30 05:00
25.03 ft
10.6 kcfs
11/30 04:00
25.02 ft
10.4 kcfs
11/30 03:00
25.02 ft
10.4 kcfs
11/30 02:00
25.02 ft
10.4 kcfs
11/30 01:00
25.01 ft
10.2 kcfs
11/30 00:00
25.01 ft
10.2 kcfs
11/29 23:00
24.99 ft
9.75 kcfs
11/29 22:00
24.82 ft
6.32 kcfs
11/29 21:00
24.87 ft
7.18 kcfs
11/29 20:00
24.83 ft
6.48 kcfs
11/29 19:00
24.88 ft
7.37 kcfs
11/29 18:00
24.8 ft
6 kcfs
11/29 17:00
24.85 ft
6.82 kcfs
11/29 16:00
24.85 ft
6.82 kcfs
11/29 15:00
25.01 ft
10.2 kcfs
11/29 14:00
25.02 ft
10.4 kcfs
11/29 13:00
25.03 ft
10.6 kcfs
11/29 12:00
25.01 ft
10.2 kcfs
11/29 11:00
25.03 ft
10.6 kcfs
11/29 10:00
25.05 ft
11.1 kcfs
11/29 09:00
25.04 ft
10.9 kcfs
11/29 08:00
25.06 ft
11.3 kcfs
11/29 07:00
25.07 ft
11.6 kcfs
11/29 06:00
25.07 ft
11.6 kcfs
11/29 05:00
25.06 ft
11.3 kcfs
11/29 04:00
25.08 ft
11.8 kcfs
11/29 03:00
25.09 ft
12.1 kcfs
11/29 02:00
25.09 ft
12.1 kcfs
11/29 01:00
25.07 ft
11.6 kcfs
11/29 00:00
25.02 ft
10.4 kcfs
11/28 23:00
25.03 ft
10.6 kcfs
11/28 22:00
25.02 ft
10.4 kcfs
11/28 21:00
24.96 ft
9.03 kcfs
11/28 20:00
24.93 ft
8.37 kcfs
11/28 19:00
24.95 ft
8.81 kcfs
11/28 18:00
24.97 ft
9.27 kcfs
11/28 17:00
25.06 ft
11.3 kcfs
11/28 16:00
25 ft
10 kcfs
11/28 15:00
25.07 ft
11.6 kcfs
11/28 14:00
25.08 ft
11.8 kcfs
11/28 13:00
25.08 ft
11.8 kcfs
11/28 12:00
25.08 ft
11.8 kcfs
11/28 11:00
25.09 ft
12.1 kcfs
11/28 10:00
25.09 ft
12.1 kcfs
11/28 09:00
25.04 ft
10.9 kcfs
11/28 08:00
25.09 ft
12.1 kcfs
11/28 07:00
25.1 ft
12.3 kcfs
11/28 06:00
25.09 ft
12.1 kcfs
11/28 05:00
25.13 ft
13.1 kcfs
11/28 04:00
25.14 ft
13.4 kcfs
11/28 03:00
25.14 ft
13.4 kcfs
11/28 02:00
25.12 ft
12.8 kcfs
11/28 01:00
25.15 ft
13.7 kcfs
11/28 00:00
25.16 ft
13.9 kcfs
11/27 23:00
25.19 ft
14.8 kcfs
11/27 22:00
25.09 ft
12.1 kcfs
11/27 21:00
25.07 ft
11.6 kcfs
11/27 20:00
25.03 ft
10.6 kcfs
11/27 19:00
25.02 ft
10.4 kcfs
11/27 18:00
25.03 ft
10.6 kcfs
11/27 17:00
25.06 ft
11.3 kcfs
11/27 16:00
25.05 ft
11.1 kcfs
11/27 15:00
25.03 ft
10.6 kcfs
11/27 14:00
25.11 ft
12.6 kcfs
11/27 13:00
25.18 ft
14.5 kcfs
11/27 12:00
25.17 ft
14.2 kcfs
11/27 11:00
25.18 ft
14.5 kcfs
11/27 10:00
25.17 ft
14.2 kcfs
11/27 09:00
25.04 ft
10.9 kcfs
11/27 08:00
25.16 ft
13.9 kcfs
11/27 07:00
25.17 ft
14.2 kcfs
11/27 06:00
25.16 ft
13.9 kcfs
11/27 05:00
25.03 ft
10.6 kcfs
11/27 04:00
25.03 ft
10.6 kcfs
11/27 03:00
25 ft
10 kcfs
11/27 02:00
25.07 ft
11.6 kcfs
11/27 01:00
24.98 ft
9.51 kcfs
11/27 00:00
25.05 ft
11.1 kcfs
11/26 23:00
24.98 ft
9.51 kcfs
11/26 22:00
25.01 ft
10.2 kcfs
11/26 21:00
24.98 ft
9.51 kcfs
11/26 20:00
25.01 ft
10.2 kcfs
11/26 19:00
25.05 ft
11.1 kcfs
11/26 18:00
25.01 ft
10.2 kcfs
11/26 17:00
25 ft
10 kcfs
11/26 16:00
25.05 ft
11.1 kcfs
11/26 15:00
25.01 ft
10.2 kcfs
11/26 14:00
25.1 ft
12.3 kcfs
11/26 13:00
25.09 ft
12.1 kcfs
11/26 12:00
25.15 ft
13.7 kcfs
11/26 11:00
25.02 ft
10.4 kcfs
11/26 10:00
25.03 ft
10.6 kcfs
11/26 09:00
25.02 ft
10.4 kcfs
11/26 08:00
25.04 ft
10.9 kcfs
11/26 07:00
25.04 ft
10.9 kcfs
11/26 06:00
25.03 ft
10.6 kcfs
11/26 05:00
25.14 ft
13.4 kcfs
11/26 04:00
25.14 ft
13.4 kcfs
11/26 03:00
25.1 ft
12.3 kcfs
11/26 02:00
25.14 ft
13.4 kcfs
11/26 01:00
25.13 ft
13.1 kcfs
11/26 00:00
25.13 ft
13.1 kcfs
Forecast Data:
Date (UTC)
Stage
Flow
12/05 12:00
25.2 ft
15.1 kcfs
12/05 18:00
25.2 ft
15.1 kcfs
12/06 00:00
25.2 ft
15.1 kcfs
12/06 06:00
25.2 ft
15.1 kcfs
12/06 12:00
25.2 ft
15.1 kcfs
12/06 18:00
25.2 ft
15.1 kcfs
12/07 00:00
25.2 ft
15.1 kcfs
12/07 06:00
25.2 ft
15.1 kcfs
12/07 12:00
25.2 ft
15.1 kcfs
12/07 18:00
25.2 ft
15.1 kcfs
12/08 00:00
25.2 ft
15.1 kcfs
12/08 06:00
25.2 ft
15.1 kcfs
12/08 12:00
25.2 ft
15.1 kcfs
12/08 18:00
25.1 ft
12.3 kcfs
12/09 00:00
25.1 ft
12.3 kcfs
12/09 06:00
25.1 ft
12.3 kcfs
12/09 12:00
25.1 ft
12.3 kcfs

Probabilistic Stage Forecast for Coushatta

Probabilistic Flow Forecast for Coushatta

Stage Exceedance Forecast for Coushatta

Flow Exceedance Forecast for Coushatta

Stage Short-term Probabilistic Guidance (Experimental) Coushatta

Flow Short-term Probabilistic Guidance (Experimental) Coushatta

Collaborative Agencies Collapse
The National Weather Service prepares its forecasts and other services in collaboration with agencies like the US Geological Survey, US Bureau of Reclamation, US Army Corps of Engineers, Natural Resource Conservation Service, National Park Service, ALERT Users Group, Bureau of Indian Affairs, and many state and local emergency managers across the country. For details, please click here.
NWS Information
National Weather Service
Shreveport Weather Forecast Office
5655 Hollywood Avenue
Shreveport, LA 71109
(318) 631-3669
Ask Questions/Webmaster
Page last modified: 23-Jun-2020 5:16 PM
Disclaimer
Credits
Glossary
Privacy Policy
About Us
Career Opportunities